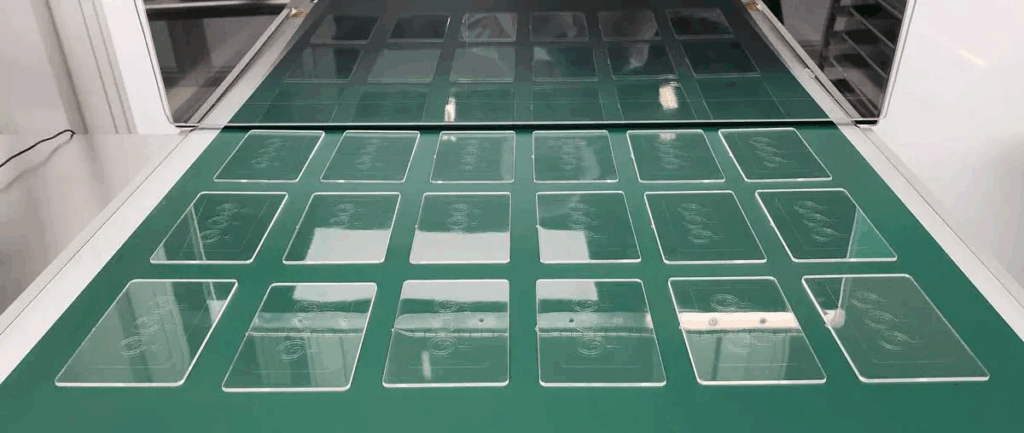
I recently had the privilege of chatting with Anuthasan Balasingam at DBM Medix (Montréal, Canada) about their LiQon™ microfluidics manufacturing process. In short, LiQon™ allows microfluidic devices to be injection moulded directly from a silicon master, which is kind of revolutionary! A photo from DBM Medix of injection moulded polydimethyl siloxane (PDMS) devices manufactured at volume at their facility is shown at right. In the next 2-3 paragraphs I’ll try to provide the context to understand why this is, so if you already understand how microfluidic devices are made out of glass, silicon, as well as hard and soft plastics, you might want to skim or skip ahead. 🙂
How are microfluidic devices made, and from what? Well, it depends; there are quite a variety of ways to make microfluidic devices, but the mainstream approaches that lend themselves well to manufacturing are few indeed. Historically, starting in the 1970s, microfluidic devices were made in glass and silicon using photolithographic processes that were ported over from the semiconductor sector, and that are also used to manufacture MEMS (microelectromechanical systems) devices. Glass and silicon microfluidic device manufacturers include Teledyne MEMS (formerly Micralyne and Dalsa; both in Canada), Micronit (the Netherlands) and Atomica (formerly IMT; USA). In the 1990s, polymer microfluidic prototyping became popular, leading to manufacturing of devices in hard thermoplastics (e.g. polymethyl methacrylate (PMMA), polycarbonate (PC), cyclic olefin polymers and copolymers (COP & COC)) as well as in softer elastomers (e.g. polydimethylsiloxane (PDMS), a silicone rubber). Thermoplastic manufacturers include microfluidic ChipShop (Germany), ThinXXS (Germany), Schott MiniFAB (Australia), while elastomer manufactuers include DBM Medix, HiComp (USA/China), and applications company Standard BioTools (formerly Fluidigm; USA) gets an honourable mention as an applications pioneer in elastomer devices. In some cases, thermoplastics and/or elastomers can be used to make devices through lamination; manufacturers include ALine and MicroMed Solutions (both USA).
PDMS, and every other device material, has particular chemical and physical properties that may make it preferable for a given application, and non-viable for another. In addition, manufacturing capabilities have evolved for all three types of materials (i.e. glass & silicon, thermoplastics, and elastomers), allowing for cost-effective production of launched microfluidic products made from each. In the end, the application’s business and technical requirements dictate the material types and manufacturing processes that are best suited.
Focussing on PDMS for a moment, it is soft and porous (for better or worse, depending on the application), relatively clear in the visible spectrum (~90% transmission from the near IR to the near UV for a 3 mm thick sample, according to a 2019 Heliyon paper from the González-García group), and can be replicated from its cast or mould master with high fidelity, including at micrometer scales, to yield optically smooth devices. Biocompatibility ranges from excellent to unsatisfactory, depending on the application. PDMS has become very popular for device prototyping over the last 20 years largely because a negative mould master can be created relatively easily from silicon, glass, metal or other material, and then the unreacted PDMS can be cast in the mould to create the positive device form, complete with microfluidic channels, chambers, etc. While very convenient for small volume production of 10s or 100s of devices, PDMS casting is not amenable to high volume manufacturing, so the majority of launched microfluidic products have been made from injection-moulded thermoplastics and/or photolithographically patterned glass and silicon, both proven high throughput, cost-effective manufacturing methods. Even if PDMS is a viable or preferred material for a given microfluidic application, it is usually left behind due manufacturing hurdles, such as its slow curing time (Dow’s SYLGARD™ 184 Silicone Elastomer (PDMS) requires 48 h to cure at room temperature, down to 10 min at 150°C), and possible need for chemical release agents to free the material from the mould.
Now, back to DBM Medix! So, what’s the big deal with their LiQon™ process for PDMS prototyping and manufacturing? It directly addresses several of the major manufacturing issues mentioned above.
Devices are made directly from silicon masters, so a) the same process for creating mould masters can be used, and b) the high fidelity fabrication of micro-features possible with a silicon master persists.
The proprietary LiQon™ process is truly injection moulding, not casting, so all the high volume manufacturing benefits of this established process apply. For example: a) shot times are short, on the order of 30 s; b) investments for both prototyping and manufacturing are low; and c) automated production and assembly are in place, so reaching high microfluidic device quality and consistency at an economical pricepoint is attainable.
Mould release agents are not required, so concerns about contamination and biocompatibility of these agents are obviated.
Prototyping turn-around times are pretty fast, around 1-3 weeks.
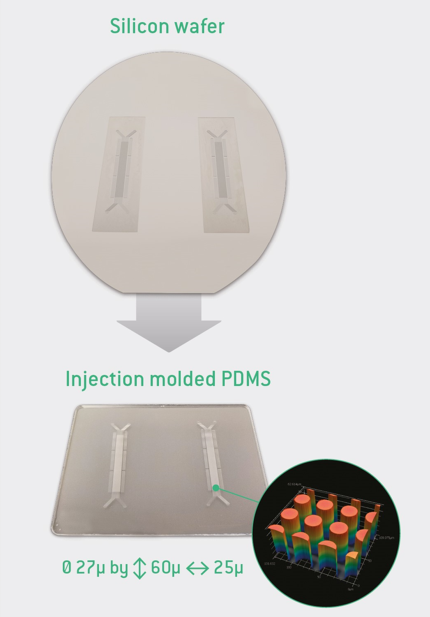
An image from DBM Medix’s LiQon™ info sheet, at right, is helpful, showing the fabrication of some 27 µm pillars (diameter x height x on-centre pitch = 27 x 60 x 50 µm). Above is the silicon wafer with the negative microfabricated pillar array (cylindrical cavities instead of solid pillars), and the injection moulded PDMS device created from it, with the pillars as positive features. A circular close up image is a scanning electron micrograph (SEM) showing the pillars up close, and demonstrating the smooth replication and clean release of these features.
If you think that PDMS could be the right material for your microfluidic/microfabricated device or concept, or if you’re not sure what material would be best, drop me a line. I’m agnostic with regard to the material or method, except that I strive to guide my client towards the materials and fabrication processes that are best suited for their application and business needs. If, after discussing your application in detail, PDMS looks like the winner or a contender, we can contact DBM Medix together to explore what doing your prototyping and manufacturing with them might look like.
As a Board Member of the Microfluidics Association (MFA), I’ve gained several new insights about different areas of the microfluidics industry over the last few years, insights that are not apparent from my usual perspective as a product development consultant. One new area for me, and a major focus for the MFA, is that of product standards and standardisation; the MFA has had leading and supporting roles in the creation of three ISO microfluidics standards (ISO 22916:2022, ISO 10991:2023 and ISO/TS 6417:2025) over the last few years, with more in the funnel, some available as downloadable white papers on the MFA site.
A major thrust in this effort is the work from the earlier MFMET I project, and now as of June 2025, the newly funded MFMET II project, on whose advisory board I sit. The Portuguese members of this consortium (Instituto Português da Qualidade, NOVA School of Science and Technology, INESC MN and Instituto Superior Tecnico, Universidade de Lisboa), led by Elsa Batista (MFMET Project Coordinator and also Board Member for MFA) published an excellent paper in Frontiers in Nanotechnology last month entitled “Advancing calibration techniques for accurate micro and nanoflow measurements“. Their research compared 4 different flow rate calibration methods for microflow pumping (syringe pumps straight to calibration, and also pumping through a microfluidic chip first) and sensing, in terms of each method’s analytical performance as quantified by accuracy and precision (more on these terms later). This is really good, rigorous work which is important for the field of analytical chemistry, for other branches of chemistry, and for other sciences and fields of engineering.
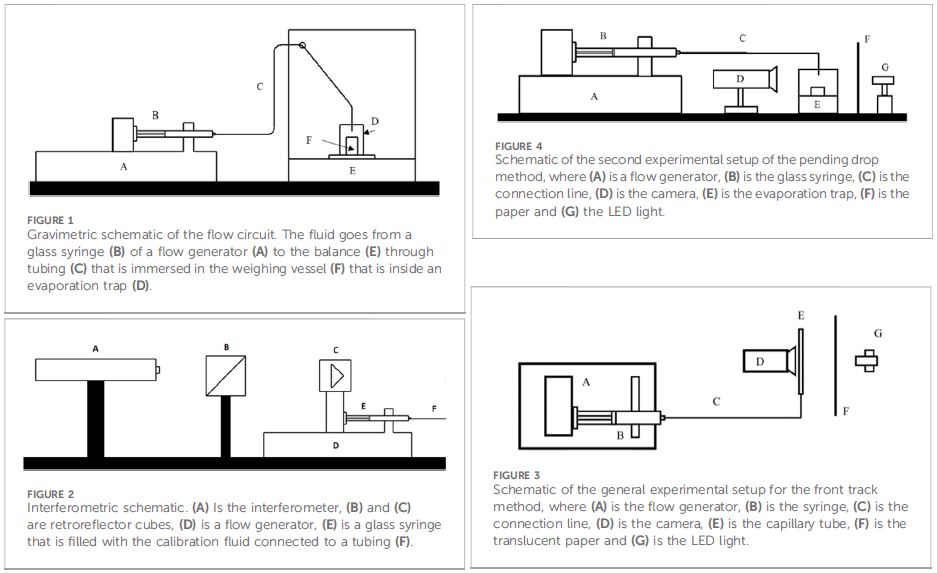
The four calibration methods used were gravimetric (measuring the mass of a pumped volume of liquid), interferometric (measuring the linear displacement of the syringe plunger optically via laser interferometry), ‘front track’ (measuring the linear displacement of the leading meniscus of the water/air interface inside a capillary via high-resolution optical imaging) and ‘pending drop’ (measuring the size of a suspended, growing droplet via high-resolution optical imaging). These methods are shown schematically in Figures 1-4 from the paper, reproduced below as Figure 1.
As any trained scientist or engineer can imagine, arriving at a valid estimation of the different sources of error involved with any of these flow rate measurements is quite involved. For all methods, the volume pumped from the syringe was quantified gravimetrically by measuring the mass of water displaced over a given syringe plunger stroke distance. All measurement instrumentation had to be validated, so calibration certificates were obtained for analytical balances, chronometers and thermometers used. In some cases, established literature values for physical constants were used. Tables showing the different error components were included for each measurement approach, including factors such as temperature, expansion coefficients, evaporation, and buoyancy, in addition to direct measurements of mass, time and distance.
Figure 2: Illustration of aiming error in terms of accuracy and precision using a target practice analogy. (Image and copyright belong to Ossila Ltd.)
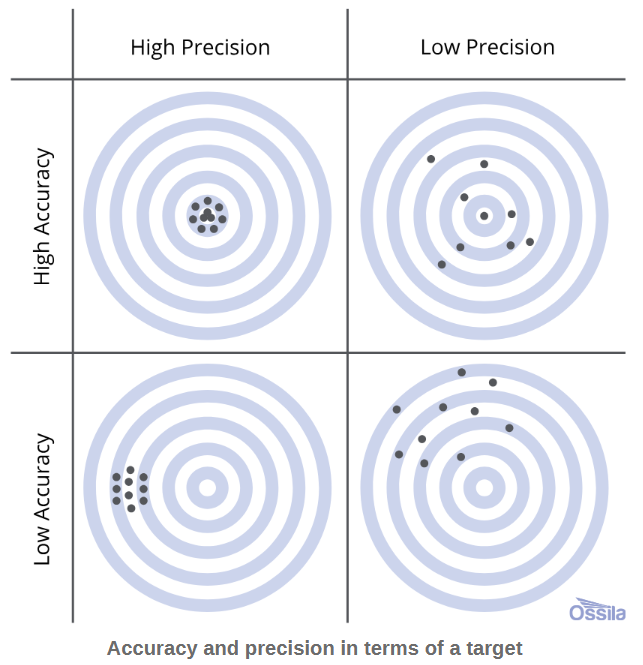
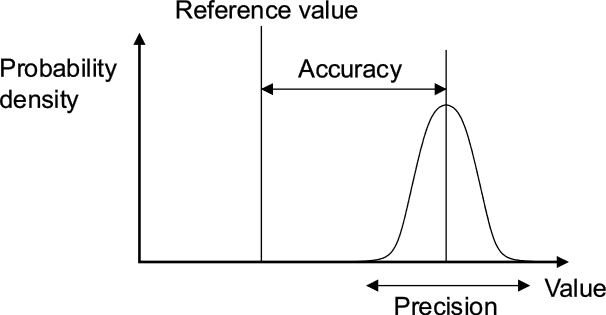
Since the methods are contrasted based on their accuracy and precision as quantitative measurements of error, it’s probably useful to define accuracy and precision as they are used scientifically: accuracy describes how close measurements are to a ‘target’ or reference value, while precision describes how close repeat measurements are to each other (regardless of accuracy). This is depicted well with a target practice analogy, as shown at right in Figure 2. In a scientific context such as the paper being highlighted, many replicate measurements are made of the variable in question (e.g. mass, volume, flow rate), to reduce the error measured by accuracy and precision. For most types of measurements (including those in this paper), if the measurements are binned and the number of measurements at any value are plotted against the value of the variable itself, a Gaussian distribution (or ‘bell’ curve) is produced. This is illustrated in Figure 3, below right. Here, the proximity of the centre of the bell curve to the ‘real’ value shows the accuracy of the measurements and method, while the spread of the measurements shown by the width of the bell curve shows their precision.
Figure 3: Illustration of measurement error as accuracy and precision. (Image is from Wikipedia and copyright belongs to Perkaje and Cutler)
In addition (and unfortunately), sometimes different fields of science and/or geographic regions use different terms or units to describe the same thing (I think pressure is the poster child, here: atm, psi, kPa, hPa, bar, mbar, Torr, mm Hg … !!). In this paper, accuracy is analogously referred to as simply ‘error’, while precision is referred to as ‘uncertainty’. (Sidebar: these terms are poorly conceived, in my view, but my short foray into terminology standards leads me to believe that they arrive by royal decree from IUPAC (International Union of Pure and Applied Chemistry). All may not hail IUPAC, with (yet more) misses like this. Anyways, end of rant, back to the story!)
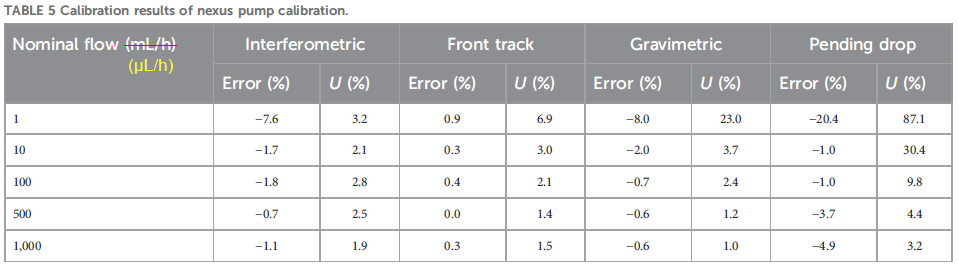
All four calibration methods were applied to a Nexus syringe pump operating at five flow rates ranging from 1-1000 µL/h, and the results shown in their Table 5, reproduced below as Figure 4. There’s a corresponding graph for this data, but unfortunately the data for each method were superimposed on each other at each flow rate, so the graph is hard to read. “Error (%)” is the relative accuracy, i.e. ((set point) – (measurement average)) / (measurement average) • 100%, while “U (%)”, uncertainty, is the relative standard deviation, RSD, or coefficient of variation, CV, of the measured values, i.e. RSD = CV = σ / (measurement average) • 100%, where σ is the standard deviation of the measured values.
This table offers the best contrast of the methods, with the precision as RSDs (“U (%)”) telling the tale. The interferometric method is the clear winner, maintaining very respectable low single digit RSDs right down to the minimum 1 µL/h tested, while front track, gravimetric and pending drop could only do this at 10, 10 and 100 µL/h, respectively. Understandably, accuracy (“Error (%)”) goes down the drain once the RSDs skyrocket, indicating the method is no longer within its dynamic range.
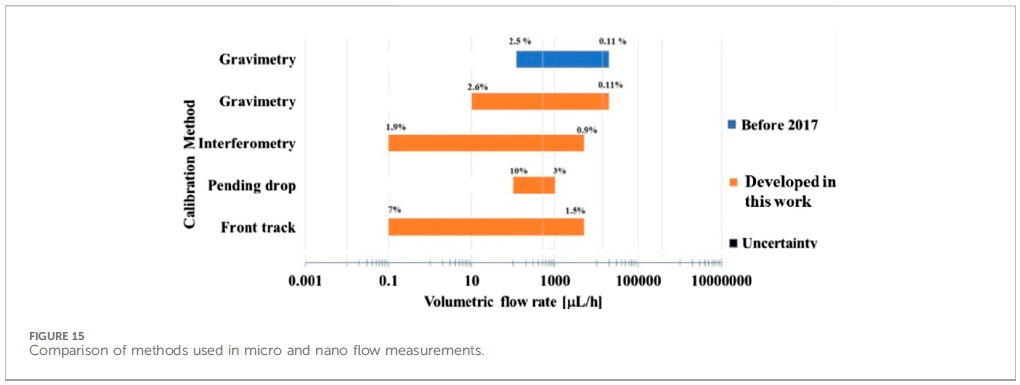
After looking at method performance for some other pumps, flow sensors, and with a chip coupled or decoupled, the team generated a bar chart in their Figure 15 to show the dynamic ranges for each method, including their previous gravimetric work. This figure is reproduced below as Figure 5.
The authors discuss the pros and cons of each method vis-à-vis their performance, highlighting that:
the superior performance of the laser interferometric method is offset somewhat by the higher cost of instrumentation;
the front track method is relatively inexpensive, and its precision (already good, IMO) could be improved with a smaller bore imaging capillary;
the gravimetric method is inexpensive, simple to implement, and offers good performance; and
the pending drop method could be improved significantly with better evaporation control.
Based on design and precision results, I would argue that the gravimetric method, while a step better than the pending drop method, is also more susceptible to evaporation, so improving evaporation control would likely improve both methods. There is also likely a way to make a diode laser-based interferometer that would be economical at volume, though I’m not sure that there are attractive applications that would warrant the product development.
This paper is solid and provides calibration information directly applicable to the pumps and flow sensors tested, but also and perhaps more importantly, information regarding the useful flow rate ranges for each calibration method. It’s a ‘nuts and bolts’ paper (like some I’ve written) that has no hope of reaching a flashy, high-impact journal, but which is of tremendous value, in my opinion, to microfluidic researchers and product developers in a variety of private sector, government and academic lab settings who can use this information as foundation material for their work.
So, what in blazes is a “coacervate”, and how does any of this relate to understanding and curing diseases, you ask? Great questions, the search for the answers to which led me to an excellent 2019 review in Annual Reviews entitled “Liquid–Liquid Phase Separation in Disease” by Alberti and Dormann at the Technical University of Dresden and Ludwig-Maximilians University in Munich, respectively. Since this part is really interesting and provides context for the relevance of the Israeli research, we’ll start here. Fair warning: this is rather complicated, but I’ll try to simplify it as much as possible, without misrepresenting anything (apologies to those in the field who detect an unwitting gaffe :-).
Liquid-liquid phase separation (LLPS) is a process by which one or several solutes in a solution self-concentrate into their own phase, essentially forming microdroplets termed condensates or coacervates. It turns out that LLPS is now believed to be fairly widespread for a number of different peptides and proteins within cells, and to underlie several biological processes; in some cases, these coacervates are essentially membraneless organelles in the cell. The review illustrates the general mechanisms by which abnormal LLPS may cause disease, such as a) genetic changes in a protein that change its solubility and thus tendency to form a coacervate, b) genetic changes in a regulator that changes when or where the coacervates forms (i.e. in the cytoplasm vs. nucleoplasm), and c) changes in physiological conditions (e.g. pH, salinity, osmotic pressure, etc.) that may promote or inhibit coacervate formation. The authors then provide generalised and specific examples of these mechanisms in action for several neurodegenerative diseases (such as Alzheimer’s, Parkinson’s and Huntington’s disease, frontotemporal dementia (FTD), amyotrophic lateral sclerosis (ALS or Lou Gehrig’s disease)), cancers (apparently many or all cancers via certain common processes such as high cellular replication) and infectious diseases (such as a large number of viruses via the formation of their coacervate viral factories, as well as many bacterial and fungal infections via common processes such as solidified cytoplasm in drug-resistant strains). Their Figure 3, reproduced above right as Figure i, is a helpful illustration of these processes happening in a cell.
Specific examples of these mechanisms are beyond the scope of this post (… and beyond my understanding of the biochemistry, if I’m being honest :-), but I find even the generalised examples fascinating, and maybe you will too. Paraphrasing directly from their caption for the figure above, here are some. In neurodegenerative diseases, mutations, abnormal posttranslational modifications (PTMs, normally used to complete the synthesis of a protein), altered subcellular localization (i.e. getting the proteins to the wrong part of the cell), or impaired protein quality control (PQC; an enzyme system that might e.g. keep a transported protein from phase-separating and losing function) can promote the formation of ectopic condensates (phase separation in the wrong cellular location) as well as precipitating to a solid, both leading to protein aggregates in diseased tissue. These aggregates can impair ribonucleoprotein (RNP) granules and cellular factors (proteins), contributing to neuronal dysfunction and cell death. In cancer, mutations in signaling receptors (e.g. nicotinic acetylcholine receptor, used to contract muscles in response to acetylcholine, or release dopamine in response to nicotine) can alter the formation of signalling clusters at sites of DNA transcription (into RNA) or DNA damage repair. This, in turn, can alter cellular signaling cascades, impair transcription or DNA damage repair, and thus promote a proliferative and malignant state of a cell (tumour growth). In viral infections, liquid-like viral factories form through phase separation of certain viral proteins, promoting viral genome replication or altering the antiviral immune response. Some antiviral sensors in our immune system detect “pathogen-associated molecular patterns” (PAMPs) and form a separate phase through LLPS upon binding to foreign DNA or RNA, thus stimulating an immune response.
So, why do any of these LLPS-based mechanisms matter? Well, the better they are understood, the better drugs and other therapeutic strategies can be designed to intercede and either hinder a diseases-based LLPS process, or promote/defend a natural one, to inhibit disease progress in the end. If we consider neurodegenerative diseases for example, it has been known for some time that they all show accumulations of cytoplasmic or nuclear proteins in certain regions of the brain, and that these protein aggregations are thought to drive the degeneration. The mechanisms by which this happens are fascinating, and are based on liquid-liquid phase separation.
In the case of ALS and frontotemporal dimentia (FTD), a key protein is “Fused in Sarcoma”, or FUS. FUS is involved in DNA transcription, repair and splicing as well as mRNA transport in cells such as neurons; in a 2013 paper entitled “Fused in sarcoma (FUS): An oncogene goes awry in neurodegeneration” published in Molecular and Cellular Neuroscience by Dormann, FUS’s role in neurodegeneration is described in detail, and its normal functions in the cell are illustrated in Figure 3 from the paper, reproduced at right as Figure ii. One failure mode is not fully performing the PTM of methylation of the arginine amino acids in the FUS protein. In FTD patients, the arginines are either unmethylated or monomethylated, which causes phase separation of the FUS, impairing its ability to act. A second failure mode involves mislocalisation of the FUS protein.
In the case of ALS, a mutation in FUS’s “nuclear localisation sequence” (NLS, the amino acid sequence ‘code’ along a protein like FUS that allows it to be imported into the cellular nucleus) impedes its ability to bind to nuclear import receptor Transportin (like an ‘admission pass’, activated by the NLS code, that allows the bearer (FUS) to enter the nucleus). Transportin not only clears its cargo protein (FUS or others) for entry into the nucleus, it also suppresses LLPS and aggregation, so impeded FUS-transportin binding leads to accumulation, phase separation and precipitation of the FUS in the cytoplasm (termed mislocalisation). In the case of FTD patients, the issue is aggregation of the Transportin itself, rendering it inactive, i.e. unable to bind to the FUS and chaperone it to the nucleus, leading again to FUS mislocalisation. Critically, these LLPS mechanisms suggest research and development opportunities in e.g. drug therapies that may block or counteract a particular disease mechanism such as genetic mutation, mislocalisation, etc.
These disease examples are the tip of the iceberg in this field of research; many more specific examples are laid out in Alberti and Dormann’s review. If the (hopefully accurate) summaries above piqued your interest, reading the full review will certainly provide a more fulsome understanding.
So, the relevance of LLPS chemistry to the modus operandi of neurodegenerative, cancer and viral diseases seems sound, but what benefit can microfluidic devices and processes confer? The answer to this is provided in the research article from Reches’ group. In a nutshell, they did a fairly thorough job of characterising synthetic coacervates made from short polypeptides, and looking at their ability to encapsulate and protect molecules within (e.g. for drug delivery).
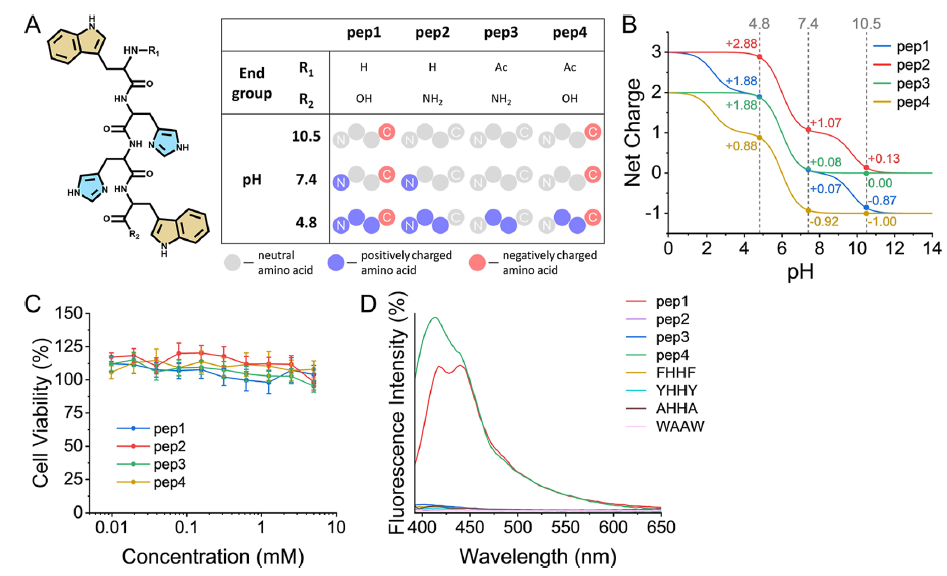
The researchers designed their four synthetic coacervates as being made from four short tetrapeptides, made from the amino acids tryptophan-(histidine)2-tryptophan, with different hydroxy, amino and acetyl terminations differentiating them. Their structure, charge states and biocompatibility were clearly shown in Figure 1 of their paper, reproduced at right as Figure iii. As a result of these different terminal groups, the four tetrapeptides, depicted in A, have significantly different pKa values at their acidic/basic groups, lending them different charges at a given pH, as shown in B. All four peptides performed well in ovarian cell viability tests (as a measure of biocompatibility), as shown in C.
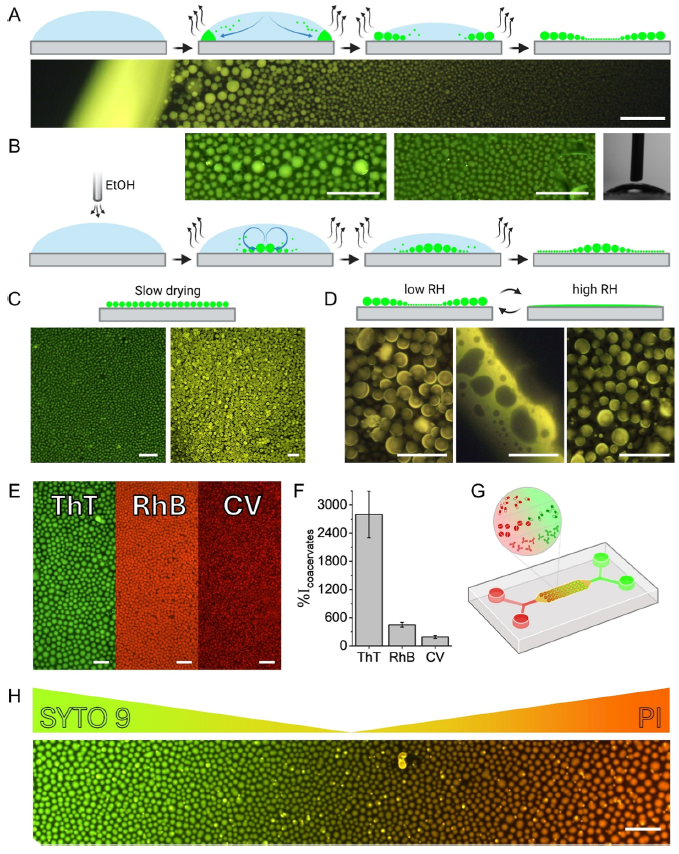
Characterisation of the formation and deployment of the peptide coacervate separated phase is well illustrated in Figure 6 of their paper, reproduced at right as Figure iv. In A, we see the normal evaporative formation of coacervate spheres (green) in a pH buffer solution; the smaller coacervate spheres are drawn to the solution drop perimeter by capillary action where they coalesce into larger droplets. The photo shows a fluorescence photomicrograph at the edge of the drop, with larger coacervate spheres towards the perimeter. The same process occurs in B, but ethanol vapour is blown over top of the solution drop to reduce the surface tension and in turn counter the capillary flow via the Marangoni effect (e.g. tears of wine), reversing the size distribution in the coacervate spheres vs. A. In C, slow drying is seen to produce a single coacervate size (or tight distribution, while in D, high relative humidity is shown to disassemble or merge the coacervate spheres (reversible with low RH). Frame E shows encapsulation of three dyes, thioflavin T, rhodamine B and crystal violet, in the coacervate spheres, while frame F shows the increase in fluorescence intensity for dye buffer solutions with the coacervate peptide vs. without (from ~2x to ~28x), showing the effective partitioning of the dyes in the coacervate phase. Frame G shows a schematic of the microfluidic device used to create dye gradients with green Syto 9 and red propidium iodide dyes, while frame H shows a photomicrograph of dye concentration gradient in the encapsulated dyes created by manipulation in the device. A somewhat closer look by the group at quantitative dye encapsulation showed a pH dependence, which is not surprising given the multiple acid groups and pKa values involved for each of the four tetrapeptide coacervates (referred to in Figure iii).
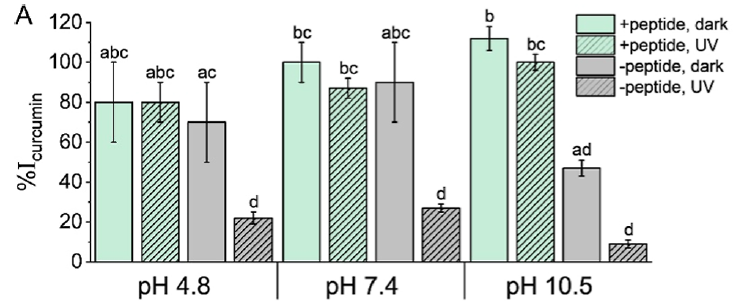
A last important area of performance they characterised was the protective antioxidant properties of the peptide coacervates on their encapsulated charge. They chose the popular dietary supplement curcumin — the natural polyphenol in turmeric giving it its yellow colour — as the encapsulated subject to test one of the coacervate’s protective abilities. Both alkaline pH and UV irradiation cause curcumin degradation and decomposition, so optical absorbance of intact curcumin was used to measure antioxidant protection afforded by the coacervate phase in comparison to a solution with no coacervate. The results are shown in their Figure 7A, shown at right as Figure v. At an acidic pH of 4.8 or neutral pH of 7.4, the unprotected curcumin (grey) was not significantly worse than the coacervate-protected curcumin (green), though the UV radiation did significantly degrade the unprotected curcumin (grey, hatched), but not the protected curcumin (green, hatched). At the alkaline pH of 10.5, both the alkalinity and UV radiation significantly degraded the unprotected curcumin (grey & grey hatched), but the coacervate was an effective protective sheath for the curcumin (green & green hatched).
If you’ve followed this far, then congratulations are in order 😉 , and let’s now consider what all this research might eventually translate into! First, let’s list some of the salient potential benefits of the synthetic tetrapeptide coacervates in the second paper:
they’re made from amino acids, and are biocompatible in ovarian cells;
they effectively encapsulate and concentrate the dyes tested;
they confer alkaline and UV antioxidant protection;
their sphere formation morphology can be tailored by several factors including humidity, ionic strength, presence of solvents (and perhaps surfactants?); and
while these first peptide coacervates are a starting point, the nature of the coacervate phase could easily be tailored through choice of peptides (or other molecules or polymers), chain length, derivatisation, etc. to optimise host/drug compatibility, affinity or selectivity, encapsulation protection, etc.
How could this knowledge be built on? The authors speculated that the coacervate characterisation and performance shown in this study could lead to bio-applications such as the development biosensors as well as the encapsulated delivery of drugs and dietary supplements. I would add that there could potentially be organ-on-chip (OOC) applications, where the interactions of synthetic coacervates with the cells of a given target disease tissue, and perhaps with the natural coacervates within, could be tested. In some cases, such OOC studies would be precursors to the development of therapeutic drug delivery systems.
The authors made an initial foray into microfluidic manipulations to generate dye gradients. It is tempting to look further at the use of microfluidics to validate the effectiveness of coacervate constituents (peptides or others) to encapsulate a drug (or other ‘cargo’ molecule) under appropriate conditions, or the effectiveness of a coacervate-drug package to be delivered to the target organ tissue cells under the physiological conditions appropriate for that organ. Just as the dye gradient was shown here, other biologically relevant gradients could be explored. For coacervate encapsulation, perhaps pH, ionic strength, coacervate and drug concentrations, etc. would be of interest; for drug delivery, perhaps drug dosage, variations in physiological conditions owing to the condition itself, or owing to an additional condition — physiological changes at the cellular level in an Alzheimer’s patient that also has high cholesterol or diabetes, for example (I’m just musing about what particulars would be relevant). The ability to easily create gradients, isolate test areas, plumb reagents in and out, multiplex the conditions explored and tightly control processes on a small scale in microfluidics can help accelerate the development of a disease therapy built on the foundation of this knowledge.
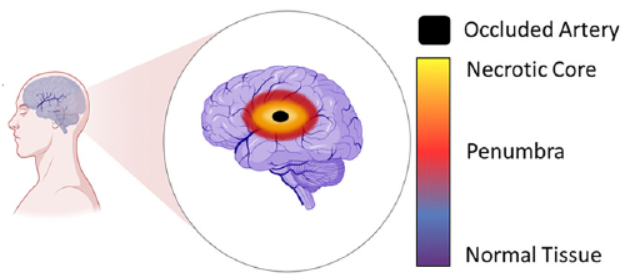
New research published in Lab on a Chip (September 21st) by researchers from the Ayuso lab (University of Wisconsin) and the Euan MacDonald Centre (University of Edinburgh) is an elegant example of a microfluidic organ-on-a-chip device. In this case, the organ is the brain, and the target disease is stroke. Stroke, or “brain attack”, is the brain equivalent of a heart attack. The majority of strokes are ischemic, typically caused by blood vessel blockage that leads to cell death in the brain tissue area served by that vessel.
The two research groups showed impressive results using rat astrocyte brain cells (which are a kind of “glia” — cells that support the brain’s neurons) to model the damage resulting from ischemic strokes, the response to reperfusion of nutrients to the deprived cells, and the viability of tissue grafting in an area damaged by stroke.
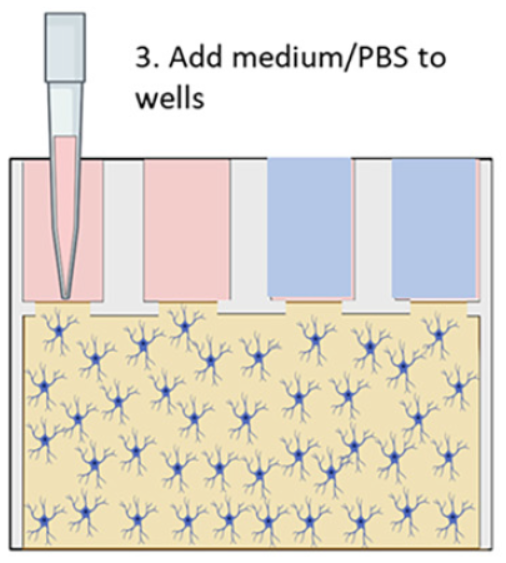
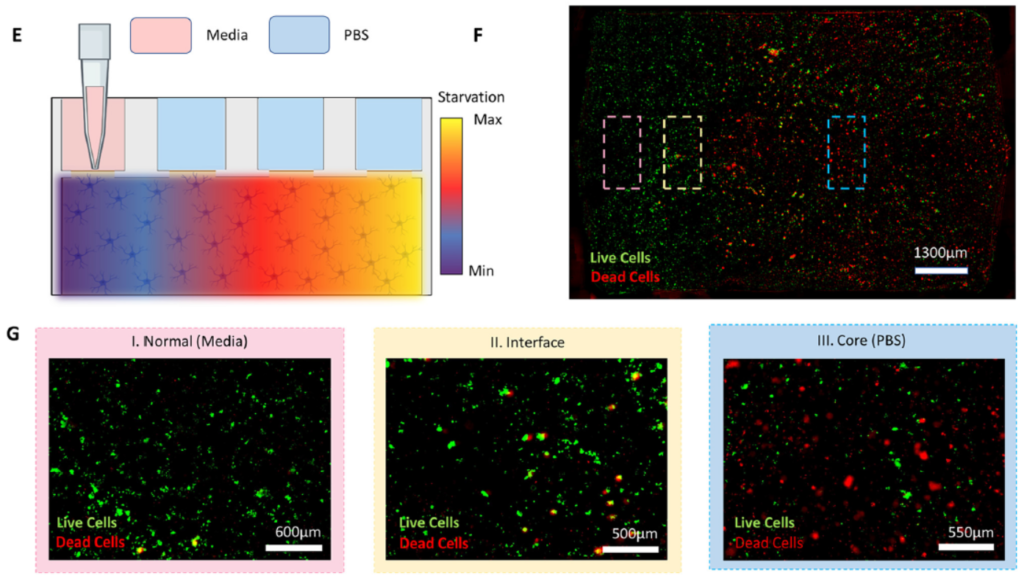
Their microfluidic brain-on-a-chip device was made from a 384-well microtiter plate with various bottom chamber configurations machined out via CNC milling, and sealed with a polystyrene laminate using double-sided tape or solvent-assisted bonding. The chambers were filled with a collagen gel/astrocyte suspension (a proxy to mimic brain tissue) through the upper well openings, and then covered by filling the wells with either a nourishing medium, to simulate normal conditions, or a simple phosphate/borate pH buffer solution (PBS) lacking nutrients, to simulate deprivation during a stroke; see Figure 2 above.
Experiments were performed to show that their simulated normal and stroke conditions over different periods of time were reflected in terms of cell viability. In addition, the extent to which cells deprived of nutrients and oxygen during a simulated stroke were able to recover when replenished with nourishing medium was explored. The schematic shown below at left in Figure 3 illustrates a simple stroke simulation experiment (E), while the microscope image at right (F) and below (G) show the resultant effects on the astrocyte cells. Live cells are stained with with a green fluorescent dye (Cell Tracker Green), and dead cells with a red dye (propidium iodide). Magnified views of the cells directly beneath, nearby, or far from the nourishing medium are also shown (G); the further from the medium, the higher the proportion of dead cells.
Adding different labelling and assaying approaches to the microscopy techniques above, they were able to model several other key stroke features. They demonstrated that reperfusion of the damaged pseudo-tissue area with nutrients from the medium after the simulated stroke did not reverse the damage done, replicating what has been observed clinically. Stroke damage was also evident in the deprived and reperfused cells vs. healthy cells by the dysregulation of certain genes critical to governing glucose metabolism; these experiments were performed by quantifying up- and down-regulation of genes using RT-qPCR on RNA obtained by bead extraction from the astrocyte-gel matrix at different stages of the experiment.
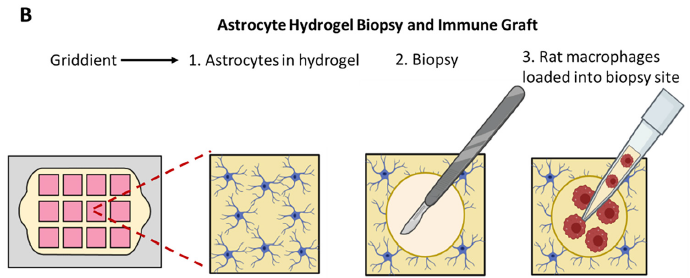
Lastly, and perhaps most excitingly, the researchers were able to show the brain-on-a-chip’s ability to potentially evaluate therapeutic treatment candidates. They punched a hole in the astrocyte gel matrix, added a suspension of macrophages (aka white blood cells; they are said to be “key players in the inflammatory response that follows stroke damage”) to the space, and imaged their movement over time with fluorescence and confocal microcroscopy. A schematic of the experiment is shown in Figure 4 below. Significant penetration into the surrounding pseudo-tissue was seen at 24h vs. 30 min.
The importance of these results is significant. The research team has shown that it can monitor the health and location of astrocyte cells with a number of analytical techniques including live- and dead-cell fluorescent tagging, and monitoring of gene regulation. It has also demonstrated that their attempt at tissue grafting showed successful cell penetration. This at least means that their brain-on-a-chip device should be tested more rigorously to explore its capabilities on several fronts — for example, monitoring movement and viability of different cells within a variety of tissues/proxies, evaluating the effectiveness of emerging, unproven stroke therapeutic treatments, etc. Furthering this research could provide invaluable insight into stroke tissue damage and regeneration techniques. Also, there is no reason to think that a similar approach could not be taken with other tissue models to characterise diseases and conditions, and evaluate therapies.
The Microfluidics Association is participating in a workshop on November 13th-14th, 2023 focussed on on metrology in microfluidics, and hosted by the metrology wing of the French Cetiat institution. In preparation, we at the Microfluidics Association (I’m on the Board) want to brush up on what the microfluidics community wants and needs as regards metrology. Here’s a letter from Henne van Heeren, fellow board member.
“For our work in developing standards and metrology protocols it is crucial that we know what the community needs. Therefor you you are invited to participate in our survey concerning prioritizing metrology and standardization work for the coming years. Your participation in this study is completely voluntary, so if you feel uncomfortable answering any questions, you can skip questions or withdraw from the survey at any point. The information you will supply will be coded and will remain strictly confidential.
This survey is held in preparation for the November workshop “on the road to standardization in microfluidics and organ-on-chip”. For more information on this workshop, please click here.
Best regards on behalf of the Microfluidics Association
Henne van Heeren henne@enablingMNT.com 0031 78 6300748
We acknowledge the support of the MFMET project, https://mfmet.eu/ and the European Metrology Programme for Innovation and Research: EMPIR.”
On behalf of the Microfluidics Association, I would like to encourage any and all working in microfluidics to provide your input about metrology via our survey. I gave my 2¢ this morning! 🙂
Figure 1: chemical structure of 3,4-dihydroxyphenethylamine, or dopamine (Source: Wikipedia)
Dopamine, shown at right for like-minded chemistry nerds, is a small molecule that acts as a neurotransmitter in the brain and as a hormone with different functions elsewhere in the body including blood vessels, kidneys, the pancreas and the immune system. The ability to detect dopamine is of great interest, since abnormal dopamine levels are indicative of neurological conditions such as depression, schizophrenia, attention deficit hyperactivity disorder (ADHD) and Parkinson’s disease.
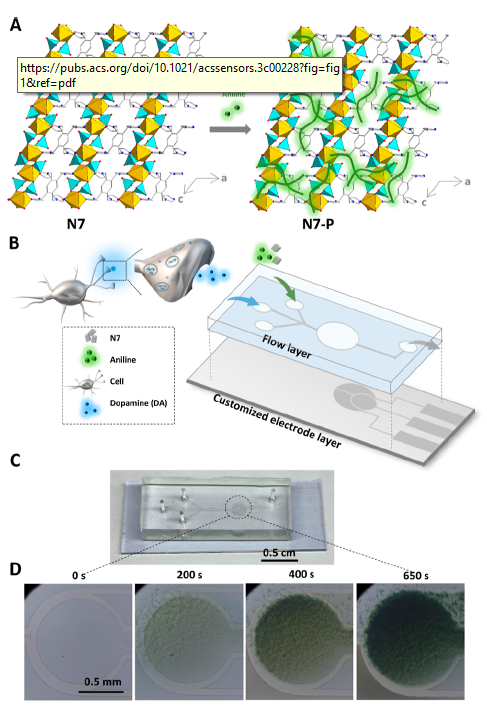
The researchers created a microfluidic device to act as the dopamine biosensor. The glass base layer had an indium tin oxide (ITO) coating patterned with a CO2 laser to form the 3-electrodes used for electrochemical detection. The fluidic cover was made by soft lithography: cast moulding of PDMS over a photolithographically patterned SU-8 master. An additional novel coating was applied to the working electrode to afford the selective sensing of dopamine. The coating, “N7-P”, was electro-polymerised via cyclic voltammetry from a solution of an indium phosphate-organic linker hybrid and analine. The graphic at right from their paper shows a) the structure of the yellow/cyan InPO4/organic linker crystalline structure (left) with added green polyaniline (right), b) electrode base (grey) and fluidic cover (blue), together with N7-P coating materials input well (top) and neuroblastoma cell/dopamine input well (middle), c) photo of assembled chip, and d) microscope imagery of working electrode during coating process of the N7-P.
Performance demonstrated by the groups’ microfluidic dopamine sensors was impressive in terms of the low detection limits and dynamic ranges seen in static and flowing configurations. With no flow, the linear range was 1 pM to 10 nM, while under flow (optimised at 50 µL/h), the range was 1 aM to 100 fM, with an LoD of 0.183 aM. Unfortunately, the authors did not disclose the dimensions of the device’s fluidic channels and detection chamber, which become significant when low concentration levels approach the need for single molecule detection, as in this case.
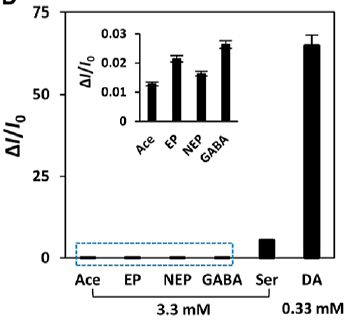
Also important was the excellent selectivity shown by the devices for sensing dopamine in the presence of five other neurotransmitters with similar structures — acetylcholine, epinephrine, norepinephrine, gamma-aminotbutyric acid and serotonin. A plot showing the amperometric response of the sensor to dopamine (DA) versus these other five potential interferents at 10-fold concentrations (labelled Ace, EP, NEP, GABA and Ser, respectively) is shown at right.
In their experiments looking at biologically produced dopamine from rat cells (> 1000 cells/mL), the concentrations measured by the microfluidic biosensor tracked very closely with the results obtained using a commercial ELISA system when larger numbers of cells were used (> 1000 cells/mL); no comparison of results could be made for smaller numbers, as the commercial system failed to generate any signal. Signal from as few as 21 cells could be sensed at dopamine concentrations of ~15 aM.
If I’ve lost you with a bunch of chemistry concentrations jargon, please accept my apologies! The salient point is, the system has exquisite sensitivity, and that can be very useful in many situations where e.g. human biopsy or research cell samples are very small, and the impact of the cells’ environment or the effectiveness of a therapeutic drug for a neurological disorder is being evaluated. Having more sensitivity is like having more horsepower: it’s (almost) always a good thing!
Another important point is that the devices are manufacturable with what look to be fairly mainstream or easily implemented microfabrication methods. They mention that the closest rival electrode coating material to afford the selectivity for dopamine are “metal organic frameworks”, or MOFs. In a table they provide (Table S2 of their supplementary information), the current biosensor’s linear range is at least 8 orders of magnitude (i.e. 80 million times) more sensitive than that seen with MOF-based electrochemical detection. It’s not clear how ease-of-microfabrication compares between MOFs and the present coating technology.
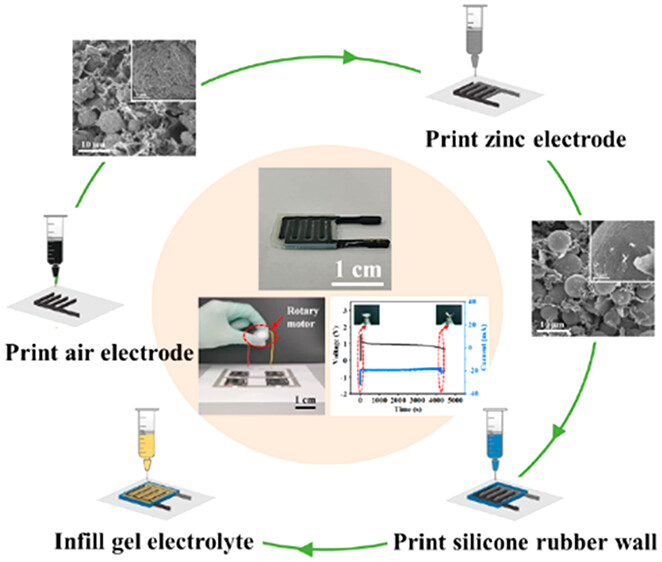
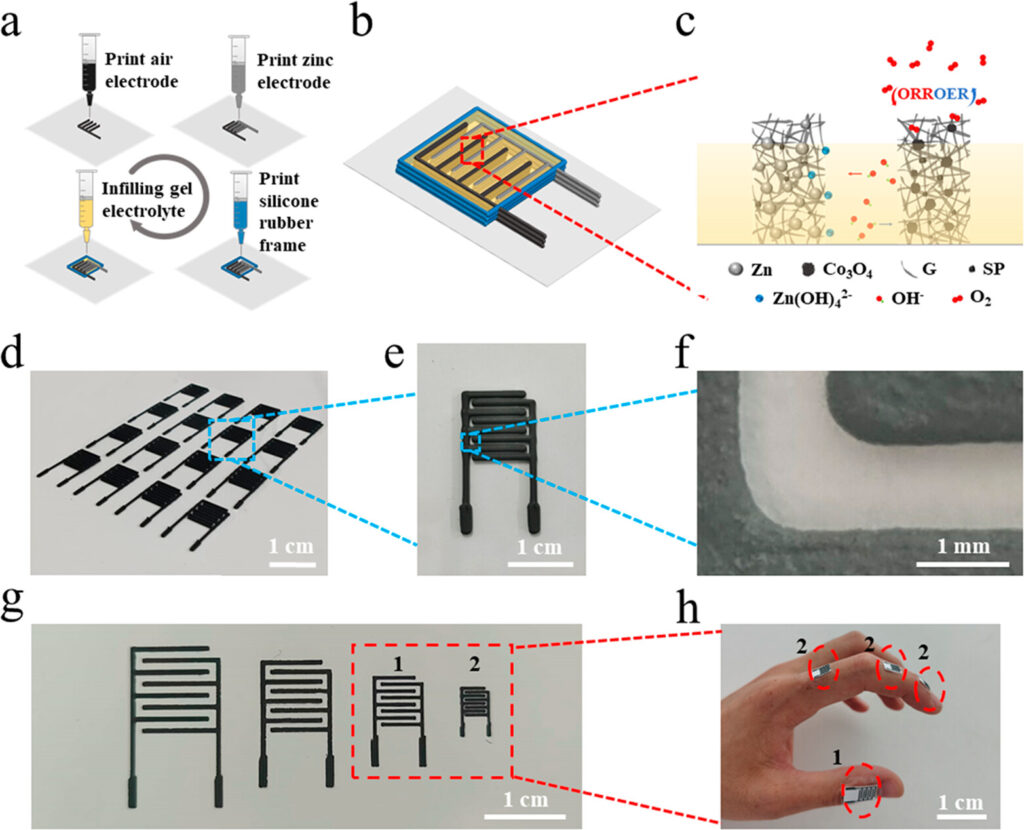
Guoxian Li and Chuizhou Meng’s groups in Mechanical Engineering at the Hebei University of Technology recently published an interesting article pre-print from the American Chemical Society’s Applied Materials & Interfaces. Their research paper shows the simple microfabrication of rechargeable batteries in the form of 3-D printed interdigitated electrodes (IDEs) on a variety of substrates. The appearance and simplified fabrication process of the batteries are illustrated in Figure 1 above right.
The paper and supplementary information provide a fair amount of detail regarding the fabrication process used to make the electrodes. Four slurries were prepared for the air electrode, zinc electrode, interelectrode gel polymer electrolyte, and silicone rubber to close the cell. Figure 2 below left shows the printing process, chemical composition, sizes and examples of the IDE batteries. The air electrode incorporated tricobalt tetraoxide (Co3O4) to catalyse the oxygen reduction during discharge and oxidation (evolution) during charging.
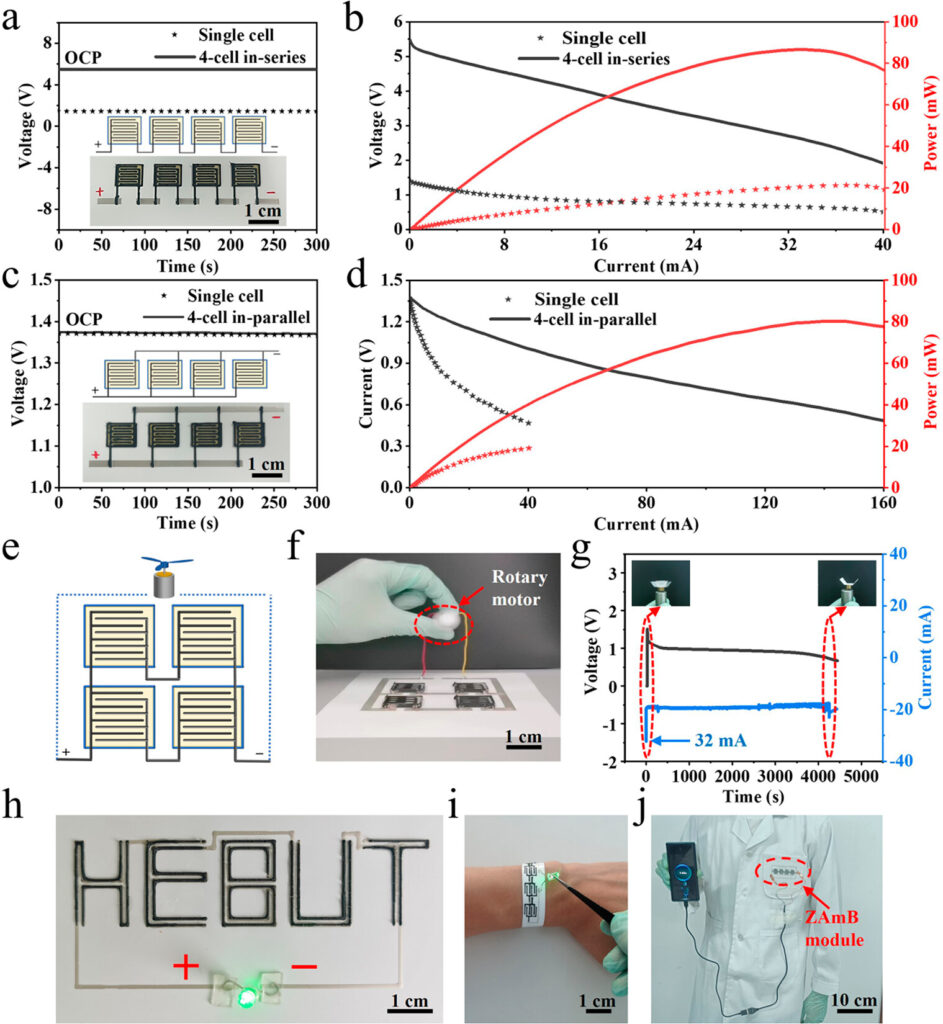
Different sizes (x, y) and thicknesses (z, depending on the number of layers deposited) of IDEs were prepared and characterised; electrode arrays were on the order of 1 cm x 1 cm, with thicknesses on the order of 1.5 mm. Arrangements with batteries in parallel (high current and power), in series (high voltage) or both were evaluated. Figure 3 below shows four batteries arranged in series (a), in parallel (c), and the polarisation & power curves for the single and 4-battery arrangements in each case for series and parallel circuits (b & d, respectively). Open circuit potential (i.e. voltage with no load) of the battery arrangements are also shown in (a) and (c). They claim high power density performance at 77.2 mW•h/cm². Lifetime of full power output varied approximately with the number of layers deposited.
Several examples of printing options and applications were also provided, demonstrating the use of the batteries in powering a fan motor (Figure 3, e-g), LEDs (h-i) and charging a cell phone (j). Interestingly, different Zn/air electrode alignments are possible, as in (h), as are different substrates. Normally, polyethylene terephthalate (PET, a common thermoplastic used for blowmoulding e.g. pop bottles, clamshell produce packages, etc.) in a flat sheet is used, but flexible wristbands (i) and cloth patches (j) were also demonstrated.
This technology shows significant promise. The use of cobalt oxide as a catalyst and zinc as a metal are important advantages. Compared to the use of expensive noble metals like platinum and ruthenium, the use of Co3O4 as a catalyst is both more economical and environmentally sustainable. Likewise, the authors and others point out that zinc-air batteries have about five times the energy density of lithium-ion batteries, and are a potentially greener alternative. I was also struck by several potential benefits in the context of MEMS and microfluidic devices. The ability to integrate microfabricated batteries to power on-board components, without requiring an additional button cell, presents more opportunities. The battery size (capacity) can be tailored to device needs, reducing costs and waste impact for single-use scenarios. Also, the fact that these batteries are rechargeable opens the door to the development of multi-use or longer use MEMS and microfluidic devices, which can significantly decrease COGS and environmental footprint in an eventual product.
Why does on-chip pH control matter? Control of acidity allows many molecular states and reactions to be regulated, e.g. for the synthesis of oligonucleotides (DNA), polypeptides (proteins), saccharides (carbohydrates), all of which are key in many areas of analytical, organic and pharmaceutical chemistry. One important area is combinatorial chemistry, which allows an array of related chemical compounds to be meticulously synthesised, and then evaluated against a target molecule for a given purpose, such as therapeutic effect of a drug, or receptor affinity as a bio marker of a disease or condition to be diagnosed. Regulating a large number of such reactions in a dense matrix array aboard a microfluidic chip means that many more reaction options can be screened simultaneously with very small amounts of reagents in an automated fashion, making for more effective drugs and diagnostics with lower development costs.
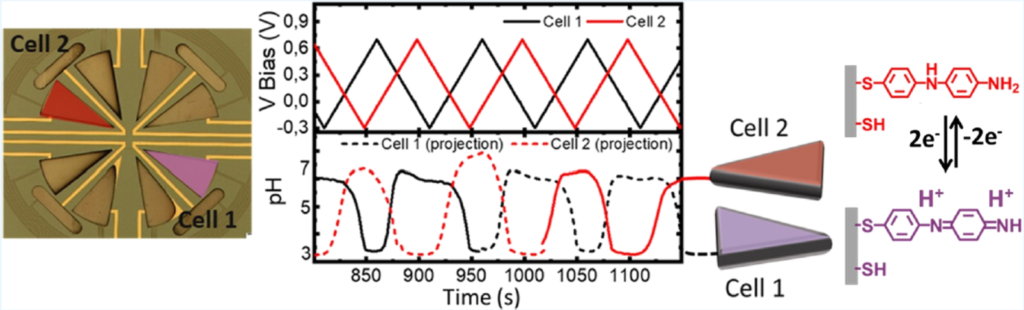
Their microfluidic devices have a Si/SiO2 base with Pt working, counter and reference electrodes, SU-8 patterned fluidic channels and removable glass lid. Ti/Au electrodes were lithographically patterned using lift-off, with subsequent electrochemical deposition of Pt and functionalisation with the electro-active species 4-aminothiophenol (4-ATP) thereafter. A photo of a 4-cell arrangement of their system, pH response and reversible reaction controlling the chamber pH are shown below.
Fairly reproducible control of pH through 100+ cycles was achieved, with pH stability lasting through holding times of up to 10 minutes. pH can also be tailored to given values between pH = 3-7 ±0.4, based on the fluorescence intensity of the carboxy semi-napthorhodafluors dye used to validate performance.
The authors have taken previous work by others using photoactive compounds for pH regulation ahead a step, by removing the need for optical interrogation of the cell. This eliminates expensive optics instrumentation and alignment issues, replacing them with mass-manufacturable electrochemical control. While the current design is not configured for high density, the 2.5 nL reaction volumes are already quite small, and it is not hard to imagine a high density layout for manufacturing. Application of this technology to the development of therapeutic drug candidates, disease diagnostics and other areas seems promising.
According to recent LinkedIn posts and a press release, polymer manufacturing leader Zeon Specialty Materials Inc. (subsidiary of Zeon Corporation, Japan) recently acquired Edge Precision Manufacturing, a microfabrication manufacturing house based in the Boston, MA area. In the world of microfluidics, Zeon is a well known manufacturer of its cyclic olefin copolymers (COPs) Zeonor® and Zeonex®, widely used in the injection moulding of microfluidic products.
The manufacture of plastic microfluidic devices is most often performed with injection moulding, given its economic edge at high volumes, and less often with hot embossing, given its slower throughput, however hot embossing has the edge for devices with more demanding fine features and fidelity requirements. Edge Precision Manufacturing, formerly Edge Embossing, is able to combine the best of both worlds with a high volume, high precision hybrid approach, where hot embossing is used for the most demanding areas of a component, and injection moulding for the more routine feature sizes.
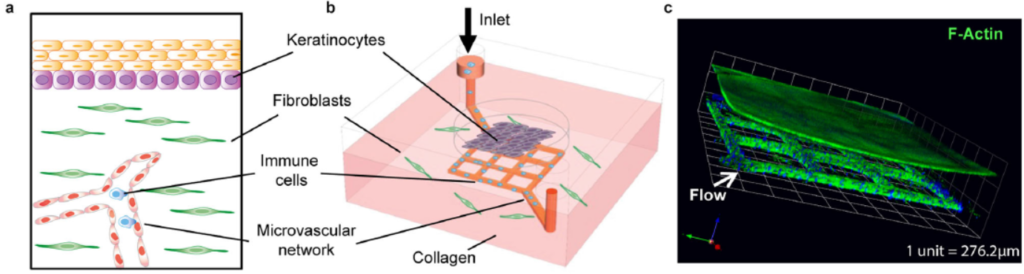
The skin-on-chip device was constructed in several steps. First, a microfluidic network with 100 µm-wide channels was patterned via soft lithography/injection moulding in a collagen matrix with dermal fibroblasts. The channels were perfused with vascular endothelial cells that lined the surface and formed a vascular network. Second, at the outer surface of the collagen chip, the epidermis was constructed: epidermal keratinocytes were seeded for 3 days, and later exposed to air to differentiate into a multilayered epidermis. The graphic above shows diagrams and a confocal micrograph that illustrate the skin-on-chip device.
The growth of the seeded keratinocytes into a fully stratified epidermis over ~2 weeks was characterised with cross-sectional images and a variety of fluorescent dyes to show the growth of the layers. Comparisons of different fluorescently stained keratinocyte markers (K14 & K10), basement membrane markers (Col IV) and vimentin in the skin-on-chip model and in native skin showed the model to accurately mimic the natural structures in native skin.
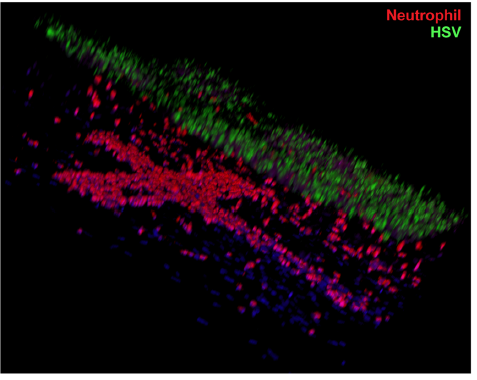
Many experiments were performed to illustrate the abilities of their platform; two are showcased here. In one experiment, the effectiveness of herpes simplex virus 1 and 2 (HSV-1 and -2) infection was tracked at various stages of dermal growth, pinpointing dramatic decreases in infection rate with completed layers of dermal growth as days progressed. After just 1 day of exposure to air and differentiation of the dermal layer, the number of infected cells dropped from 67 to 16% for HSV-1, and from 100 to 36% for HSV-2. It’s no surprise that, as skin forms or heals, its ability to prevent infection improves, but accurately determining at what time, stage of growth and to what extent this happens via a real model is powerful indeed.
In another experiment, the authors showed that neutrophils (the most abundant type of the white blood cells used in our body’s immune response) would adhere to the walls within minutes of perfusion through the microfluidic vascular network for a chip that was infected with HSV, vs. essentially no adhesion in a control chip. After hours, the neutrophils continued to accumulate, transmigrated through the endothelium and entered into the layered dermis on the chip surface. A confocal microscopy image, reproduced at right, shows the presence of red-stained neutrophils in the cross-shaped microfluidic vasculature below, and migrating upwards towards the HSV-infected skin layers above, stained green.
The effectiveness and utility of this skin-on-chip model system to monitor immune responses to disease is obvious. The authors discuss an array of investigations that can be undertaken to better understand the chemistry of immune responses. If we consider the 3-D spatial information content provided by confocal microscope imagery in the context of their stratified, vascular-epidermal microfluidic system, it seems like the sky is the limit for recreating immune and other skin-based biological/biochemical processes, and perhaps with other tissue types as well. There is a good reason this paper was accepted by Nature Communications. 🙂
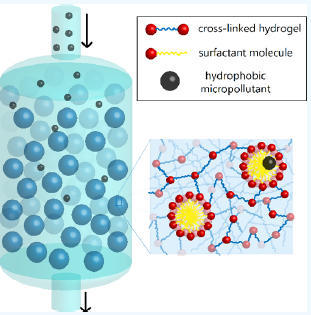
New work from Patrick Doyle’s group at MIT, just published in ACS’ Applied Polymer Materials and highlighted in MIT News, shows the simple microfluidic manufacture of hydrogel particles that can be used to remove hydrophobic (non-polar, water ‘fearing’) micropollutants from water. Their hydrogel ‘filtres’ show enhanced performance compared to activated carbon (AC); in addition, and critically, they can easily be regenerated.
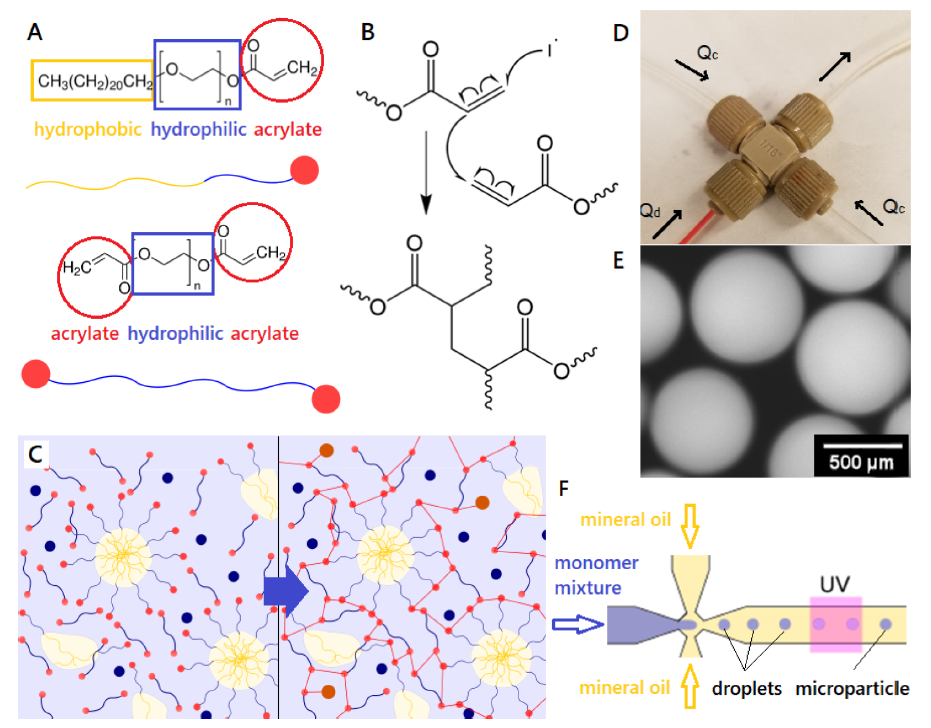
The hydrogel particles are made from acrylate-based micelles that are covalently bound into a cross-linked acrylate gel. The diagram above from their paper illustrates the nature of the micelle monomers and cross-linkers (A); the polymerisation reaction (B – I’ll pretend I understand exactly what’s going on, there …;-); the solution (left) before polymerisation, with free micelles spontaneously formed, and (right) after (UV) polymerisation, with the micelles fixed in the gel polymer (C); the microfluidic cross used for droplet/particle formation (D); a micrograph of the 500 µm gel particles (E); and a diagram showing the formation of the droplets in the microfluidic reactor that polymerise under UV light to form the gel particles.
The microfluidic reactor in this case is simply made from off-the-shelf components: a microcross such as from Idex (150 µm through-hole) and 1/16″ OD tubing. For R&D, this is an ideal set-up: fairly cheap with parts delivered in days and set up in minutes. For manufacturing, it’s only a small leap to replicate this structure in polymer or glass and set multiple microfluidic synthesis networks up together in parallel to reduce the cost contribution of the microfluidic reactor.
To remove the pollutants from a water sample, water is passed through a column filled with this hydrogel, and the hydrophobic pollutants partition into the hydrophobic micelle centres, analogous to reverse-phase chromatography, with the pollutants being highly retained in the stationary phase. Once the hydrogel is saturated with pollutants, it can be regenerated with an ethanol flush, purging the column of bound pollutants; the authors claim it will maintain performance over years of such regenerative cycles. Different micelle monomer hydrophobic tails can be used to optimise the affinity and partitioning coefficient for a variety of pollutant targets.
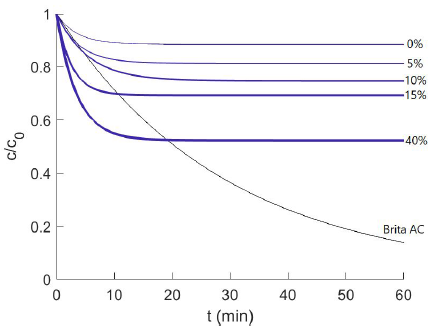
The performance of the hydrogels stacks up very nicely against activated carbon filtres which are the current gold standard in many applications. Doyle’s group measured the performance of a variety of different micelle compounds in their hydrogels against each other and activated carbon for their micropollutant model compound, 2-napthol (used in the manufacture of dyes, fungicides, insecticides, pharmaceuticals and perfumes; carries the H400 classification of “very toxic to aquatic life”). The graph at right plots pollutant removal over time for a particular micelle formulation, F127DA. The ordinate is c/c(o), or the concentration of pollutant left in the test solution vs. initial concentration; the faster and greater this drops, the better the performance. The four different exponential decay curves (blue) correspond to different quantities of micelle surfactants bound in the hydrogel: 0 to 40% surfactant concentration in the gel; the grey curve is for Brita activated carbon. The plot shows that higher percent quantities of micelles bound in the hydrogel lead to pollutant removal in greater quantities and at faster rates. On time scales under 10 minutes, typical for water treatment contact times, both the 15 and 40% F127DA formulations handily outperform the activated carbon, although longer timescales favour the AC.
The authors highlight the fact that their hydrogels can be regenerated with ethanol, using between one thousandth to one billionth the volume of EtOH vs. water treated, and show good performance for cycles subsequent to regeneration. They also note the very energy-intensive process needed for regenerating AC filtres. While it seems they have effectively shown good performance from their hydrogels for both filtration and re-usability, what is missing in the comparison, in my view, is a clearer contrast of economic and environmental drivers. For example, potential costs/year for filtre replacement, ethanol/energy consumption, releases to the environment, etc. That is arguably the product developer’s job, and perhaps this paper’s performance will pique the interest of some entrepreneurs, hopefully with well-heeled partners.
Juncker’s group excels at capillarity-driven microfluidic devices, and they wrote an excellent critical review paper in Lab on a Chip a few years ago on ‘capillaric circuits’. It provides a full description of the physical chemistry of Laplace pressure and surface chemistry that underpin the capillarity-driven microfluidic operations used in these devices. While the full depth of the chemistry and physics is beyond the scope of this blog article (and the author’s RAM capacity ;-), they may be explored separately in a future post. Suffice it to say that, while somewhat involved, the capillarity-based pumping, valving and timing technology is well understood and and fairly well developed by this group, amongst others.
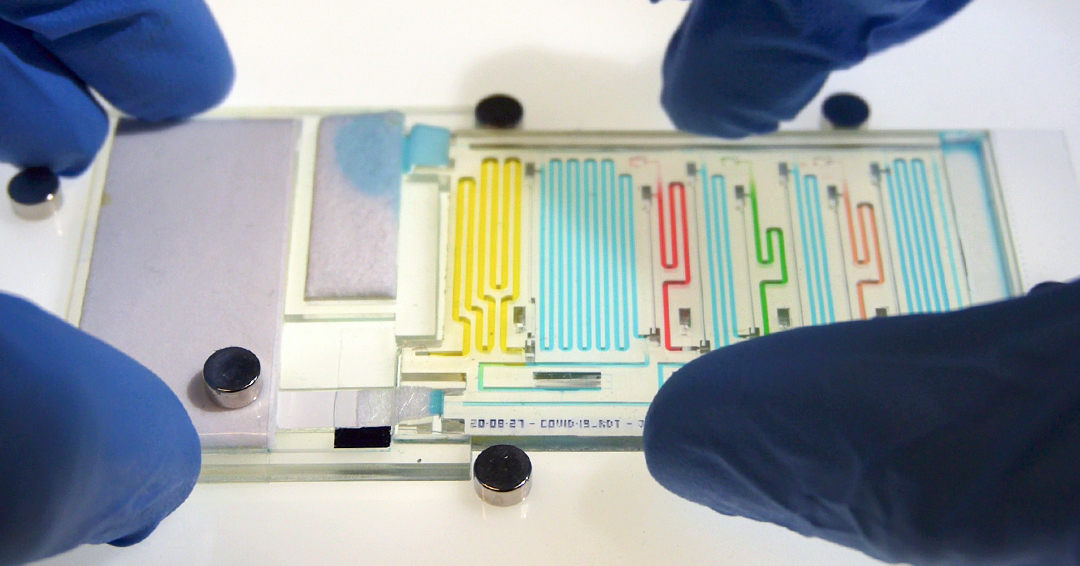
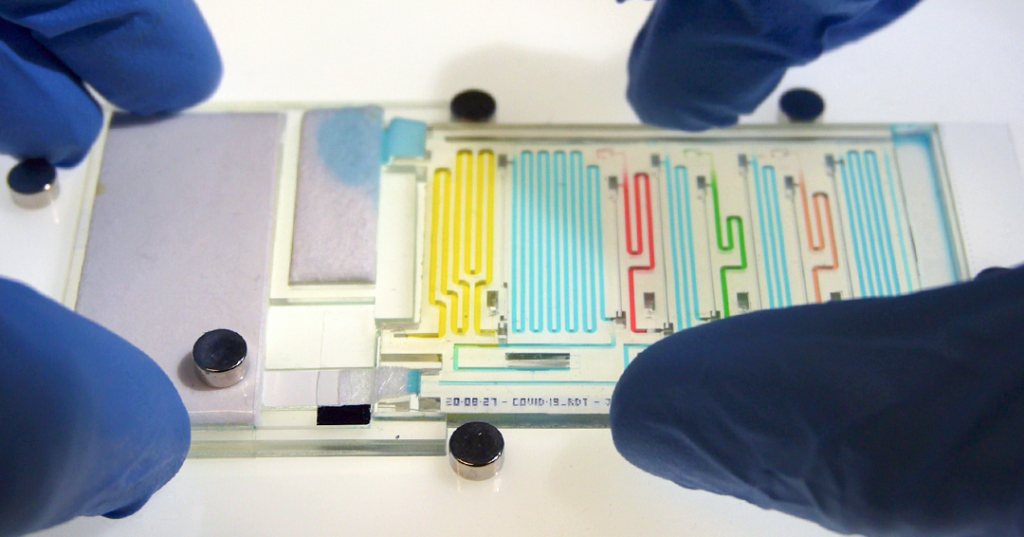
In this work, they are moving from the ‘mere’ sequential delivery of a few liquids at a channel intersection to fully configured, multi-step analyses using hundreds of sequential pre-programmed liquid manipulations. A first chip enables sequential delivery of 300 sample aliquots, while the second, shown above, performs the 8-step ELISA detection of COVID-19 antigen found in a patient’s saliva sample . Some impressive videos showing the performance of the 300 aliquot chip and the COVID-19 diagnostic chip can be found in the McGill article.
For someone like myself working in the field of microfluidics, perhaps the most thought-provoking aspect of this article is the potential for the technology to dramatically simplify the operation of fairly complex microfluidic devices. Being able to programme sequential volumetric flows with precise timing with a virtually unrestricted number of on-chip steps, all under autonomous operation, has far-reaching implications. It means that, after addition of sample(s), the device will simply start its protocol, with no interaction needed from an instrument or human operator. Using existing, fully developed on-board technologies such as lyophilised reagents and mixing procedures together with simple visible bands for detection such as with COVID-19 rapid tests, the door to many other more complex medical diagnostics, industrial or environmental assays is now open.
Development of products to meet these application needs will no doubt carry challenges, but at the end is a cheaply manufactured, complex device that can be used at the point of care or need; this represents a huge foundation on which to build any number of enabling, disruptive products.
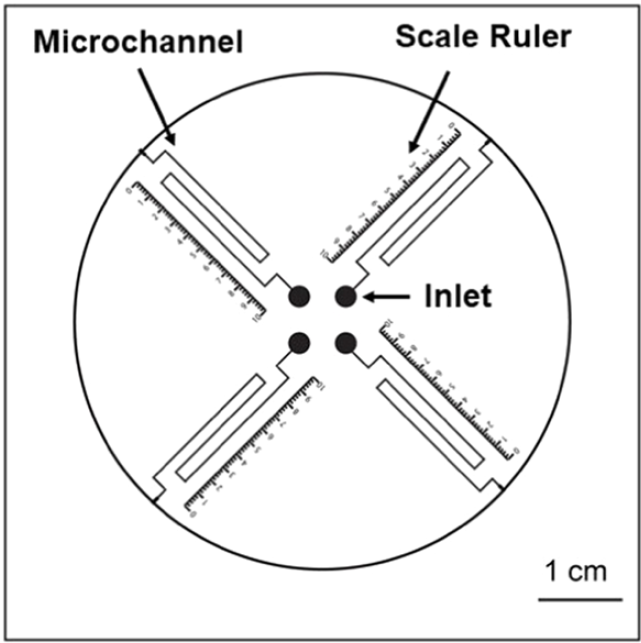
Xiujun Li’s group at the University of Texas at El Paso recently published an article in Analytical Chemistry that builds on the “V-chip” concept from a 2012 Nature Communications publication by the Qin group. The chip uses the position of a visible liquid in a channel to allow the user to quantitatively determine the concentration of an analyte of interest by simple visual inspection – no detector needed!
Thermometer-like readout device from Li group at UTEP (Copyright: American Chemical Society)
The chip (schematic at right) operates similarly to an alcohol or mercury thermometer in which the user reads the liquid meniscus level against a scale to determine the temperature. In the case of these microfluidic V-chip devices, the liquid level moves in response to the concentration of an analyte. In the seminal paper by Qin in 2012, the liquid plug was driven by gaseous products generated in a reaction with the analyte. A sandwich ELISA (enzyme-linked immunosorbent assay) reaction was used in which the unbound antibody was labelled with nanoparticles conjugated to a catalase enzyme. At the end of the ELISA reaction, the bound catalase labels reacted with preloaded hydrogen peroxide in the solution to produce oxygen gas in proportion to the amount of analyte initially present. The liquid ink was driven along connected ‘thermometer’ microfluidic channels and measured accordingly to determine the concentration of analyte. This volumetric relationship gives rise to the V in V-chip.
Result from a sample with 64 ng/mL PSA in phosphate buffered solution (PBS) (Copyright: American Chemical Society)
In the work of Li’s group, a sandwich ELISA is also used, but the labelling and gas generation are different, and arguably improved. Instead of generating gas enzymatically with catalase, it is generated photothermally with a near infrared (NIR) laser. In their work, the analyte of interest is the prostate cancer biomarker PSA (prostate-specific antigen), and the unbound antibody is labelled with an Fe3O4 nanoparticle. The nanoparticle is chemically converted to a Prussian Blue (PB) nanoparticle which is a strong NIR-absorbing photothermal agent. At the end of the ELISA reaction, an NIR laser is shone onto the sample chamber and the incident radiation is converted by the PB nanoparticles to heat and generates vapour, causing liquid to be driven along the thin radiating ‘thermometer’ channels. The extent of displacement of the liquid again depends directly on the amount of PB nanoparticle-labelled antibodies present, which is a function of the concentration of PSA to which they bind. An example with blue dye showing the liquid after ELISA reaction and photothermal interrogation is shown above right.
The V-chips in both studies offer the huge benefit of not requiring any measuring instrumentation for detection; no optical or electrochemical detector, signal processing and display required. With a properly designed microfluidic chip and calibrated scale, the results of an ELISA-based cancer biomarker assay can be read directly from the chip like a thermometer. The dramatic reduction in complexity and cost can be a huge gain in a derived product concept. In addition, Li’s work uses a photothermal heating process in lieu of the second enzymatic reaction (catalase) in the analysis chain, which both simplifies the procedure, and is likely to make it more robust, since photothermal heating is more controllable and reproducible than an enzymatic reaction. The cost for this is an added on- or off-board NIR laser and lens, both of which can be mass-fabricated cheaply. This approach potentially improves analytical performance, which could in turn be an enabling piece of the technology foundation for a related product.
In a recent Forbes profile, author Peter Cohan suggests that 908 Devices, based in Boston, may be a good company to consider for investment. He notes that they are doing several things right that are keeping them nimble, including attracting top talent, empowering employees closest to clients, launching products quickly and fighting bureaucracy.
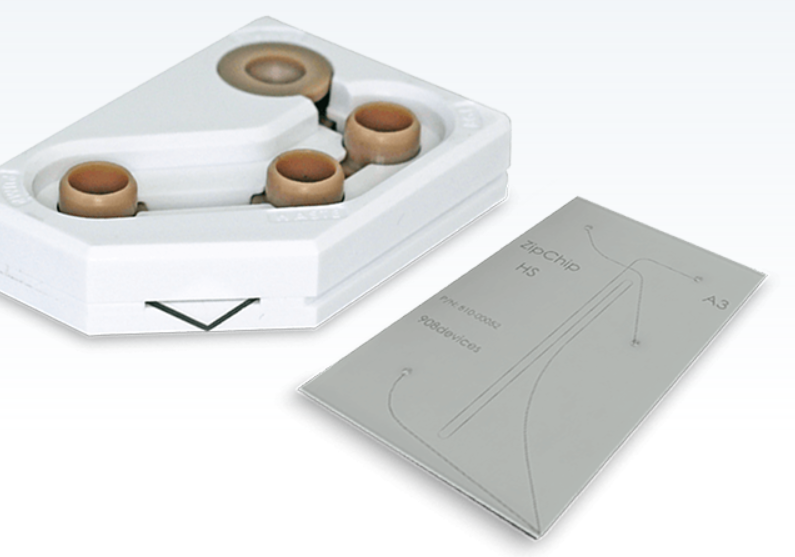
Zip Chip ESI microfluidic device. Copyright: 908 Devices
The company uses microfluidic chips for electrophoresis-based sample preparation and electrospray ionisation (ESI) for sample introduction into their revolutionary desktop or hand-held, low power, high (atmospheric) pressure mass spectrometers (HPMS) that perform the sample analysis. In some cases the HPMS operates alone. More information is available on their website, including a listing of their suite of patents relating to both the microfluidic ESI and HPMS aspects of their core technology. Applications vary from cell biology analysis, detection of drugs (e.g. fentanyls, opioids and amphetamines), explosives and chemical warfare agents. Importantly, the chips are easy to use, and instrumentation is coupled to powerful electronics and software to automate all operations and analysis computations, and thus afford a simplified, practical interface suitable for a broad base of operators.
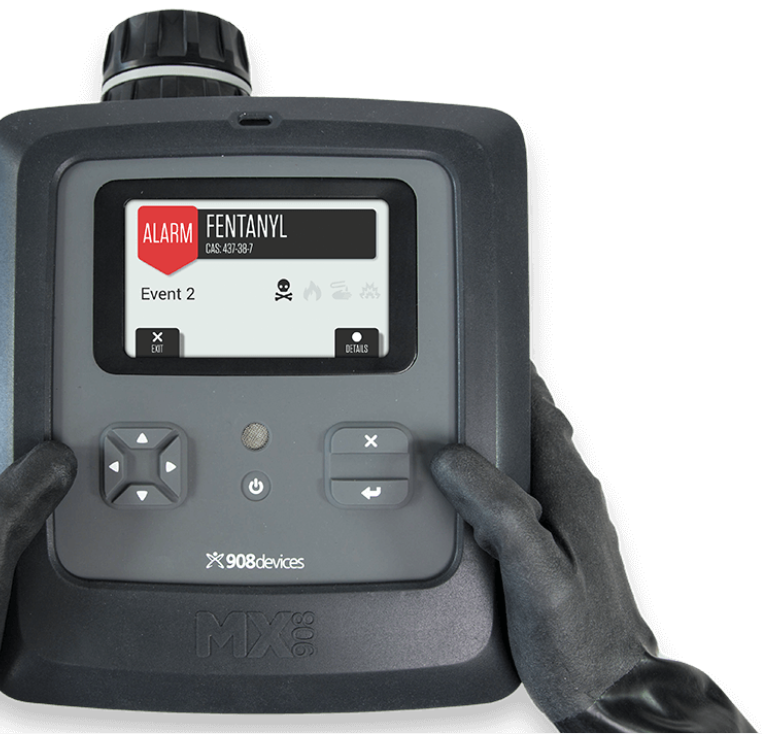
MX 908 system. Copyright: 908 Devices
The company was founded 9 years ago, and had its IPO in December, 2020. It’s stock has dipped slightly, but revenue grew by 50% last year to USD $26.9 M and is projected to grow another 45% in 2021. The company also just landed a USD $25M purchase contract from the US Army for 350 of its MX908® portable MS instruments for on-site explosive threat detection and evaluation applications.
Cohan notes that 908 Devices avoids agility potholes such as forcing valuable employees who intimately understand the technology, customers and competition to do “tooth-cleaning-like reviews” for C-suite executives. CEO Kevin Knopp noted in his interview with Cohan that they intentionally maintain a fairly flat organisational structure, hire high-calibre talent, and empower their employees to listen to customers and react accordingly.
Cohan summarises: “If 908 can figure out an easy button for sustaining 50% annual revenue growth, its stock is a buy.”
Our beloved dog Fezzik … equipped with standard superior olfactory prowess
As both a proud and loving owner of a loyal golden doodle (Fezzik) and an analytical chemist, I couldn’t resist this one! I also can’t resist posting a photo of our family’s lovable hot dog burglar, Fezzik. He’s in his winter attire in this photo from last Saturday morning’s breezy -34°C walk. He’s amazingly well adapted to the cold, with enough circulation to keep his exposed nose and thin ears nice and warm no matter what!
But I digress. Did you know that man’s best friend is an analytical chemistry superhero? Well, I guess we are all familiar with the notion that dogs have incredibly sensitive noses. We may have seen handlers harnessing their dog’s superpower for good, such as with drug sniffer dogs at airports and accelerant sniffer dogs at arson crime scene. A dog/hander team photo of German Sheppard Ezra and Jeff Lunder of CADA Fire Dogs from the Harynuk paper described below is shown below.
Ezra and handler Jeff Lunder at work in a forensic fire investigation. Picture from Forensic Chemistry article.
It should perhaps come as no surprise that there’s some really cool biology behind their abilities. Chemist and founder of Chemistry Matters Dr. Court Sandau recently posted a link on LinkedIn to an excerpt of a talk he gave describing the special design of canine olfactory systems – have a look. Dogs have 300 million sensing cells (~50x as many as humans), direct over 10% of their inhaled air over these sensors, and can expand the area at will to allow for expanded sensitivity … absolutely fascinating!
It may come as a surprise, however, to learn that their olfactory power is more sensitive than the best analytical chemistry methods and instrumentation, and that this actually causes us problems as they work their magic. The dilemma arises when a forensic lab cannot detect the presence of an accelerant that a dog very likely correctly identified, due to the lab’s inferior limit of detection (LoD, the lowest amount or concentration for which something can be detected by a dog, detector, etc.); such a situation can potentially render arson evidence inadmissible.
A paper published in Forensic Chemistry last year by Professor James Harynuk’s group at the University of Alberta tackled the first step in addressing the gap between canine and analytical instrumentation/methodology performance: determining the canine limit of detection for an accelerant. With an idea of dogs’ capabilities, analytical chemists would at least know the target they are trying to hit!
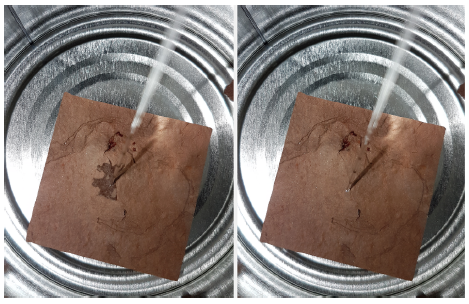
Sample being applied to tile, left, and after 10s to allow the dichloromethane solvent to evaporate, left. Picture from Forensic Chemistry article.
A great deal of effort was required by Harynuk’s group to conceive of and validate methods to clean and prepare slate tile substrates to receive accelerant samples; the extent of initial contaminants and cleaning effectiveness was demonstrated with solid phase microextraction followed by gas chromatographic – mass spectrometry headspace analysis. They also had to research and chose suitable solvents and stabilisers in which to prepare diluted accelerant solutions. Taking great care to eliminate any source of bias for the dog and handler during the identification trials, Harynuk’s team applied an increasingly diluted range of accelerants such as lighter fluid, regular gasoline and diesel gasoline, to slate tile substrates located amongst blank and control tile samples with other petroleum components typical of a scene. An example of a sample being applied to a tile substrate is shown at right. For the trials, two dog/handler teams were brought in to determine their ability to correctly identify the spiked tile from the group, and at increasingly weaker doses. Both dog/handler teams were able to correctly detect tiles spiked with as little as 5 pL of gasoline (1 pL is one billionth of 1 mL)!
And so now we know why it is that, when we quietly peel the film wrap off steaks to be prepared for the grill, our dog smells it from the other end of the house, two stories up, and comes running with eyes full of hope and obedience … before the first dash of steak spice has hit the meat!
A recent technical note in Analytical Chemistry from Professor Carolyn Ren’s lab at the University of Waterloo demonstrates an efficient and controlled approach for on-demand microfluidic droplet generation. The technique is used in a variety of important bio-medical and industrial applications such as: single or multiple cell sorting, culturing and incubation; droplet-based PCR and DNA sequencing; and chemical synthesis including micro- and nanoparticle synthesis.
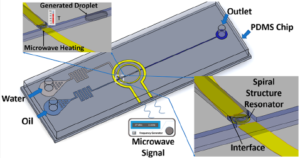
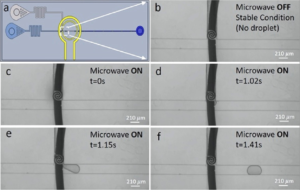
Microfluidic droplet generation at a tee intersection on a chip can be initiated or controlled by several approaches or factors such as balancing input pressures, channel intersection geometry, and surface tension at the interface. The latter offers an opportunity for fine control: input pressures for immiscible carrier and droplet fluids are nearly matched, and alteration of the surface tension and thus Laplace pressure at the interface meniscus will lead to on-demand droplet generation. Surface tension is a function of the chemical composition of the carrier and droplet fluids as well as temperature, so localised heating at the meniscus can enable fine control of droplet generation. On-chip resistive thermal heating works well, but has a slow response; laser cavitation is much faster, but requires expensive, delicate optically aligned off-chip instrumentation. The authors’ choice of on-chip microwave heating, shown at right above, has very rapid response times, is implemented with very simple (and cost-effective) microfabricated heating resonator electrodes, and affords precisely localised heating based on electrode design and chemically selective absorption of microwave energy by the aqueous droplet fluid (and not the carrier oil or PDMS device material).
Time-lapsed photographs of droplet generation of water (vertical channel) in carrier oil (horizontal channel) using their system are shown at right below; the curved black line is the electrode under the vertical channel. The research showed a relationship between applied microwave power and generation time, but with droplet sizes remaining at a constant ~1.8 nL in their 40 µm deep x 210 µm wide channels.
The advantage of repeatable, precisely controlled on-demand droplet generation for the many fields in which droplet-based microfluidics is used could be important. The fact that it should be manufacturable from different microfluidic device materials without expensive instrumentation is a considerable advantage as well. The localised nature of the heating could also be beneficial in thermally sensitive assays where excessive and/or prolonged heating is detrimental.
Impressive research coming out of the Revzingroup at the Mayo Clinic’s Department of Physiology and Biomedical Engineering shows an improved approach to first culture and then evaluate cell responses to chemotherapy treatments using polydimethyl siloxane (PDMS) microfluidic devices cast from silicon masters. The research was published in Microsystems & Nanoengineering in October (DOI: 10.1038/s41378-020-00201-6).
Ovarian cancer often has a very poor prognosis when detected due in large part to the inaccessibility of the ovaries for many diagnostic methods, and the late-stage in which diagnoses are usually made. As a result, there is a strong focus on improved therapeutic strategies to best use the brief window available for treatment of the advanced disease. One such strategy is to use ‘patient-derived xenografts’ (PDXs) where tumour tissue cells are implanted in a mouse to allow the cancer to be monitored in parallel to that of the patient. While valuable to determine the effectiveness of various chemotherapies, PDX requires research animals, experienced animal researchers, high costs and long timelines. As a result, in vitro ‘organoid’ or ‘spheroid’ 3-D cancer cultures are being explored on 96-well microtiter plates, Matrigel plates and other array platforms to arrive at suitable replacement environments. As comparison standards for their microfluidic design, the authors used Matrigel and microtiter plates approaches, with the latter having PDMS inserts with microwells identical in size to the microfluidic counterpart. A graphic depicting the three approaches is shown above at right.
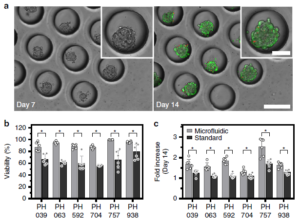
A first advantage of their microfluidic platform is that it can easily make use of the miniscule amounts of cells afforded by a fine needle biopsy sample. Secondly, the on-chip incubation environment appears to be superior to that of standard microtiter plates when using identical media and culturing methods. After 14 days, 0n-chip viability was typically ~90% vs. ~60% & ~80% for standard microtiter and Matrigel plates, respectively; growth of the spheroid cluster of cancer cells was also significantly better using the chip platform. Figure at right shows micrographs of the spheroid cell clusters in the microfluidic wells (a), and a comparison of viability (b) and spheroid size growth multiple (c) over 2 weeks. Lastly, a multiplexed design shown below at right was created to allow serial and parallel perfusion across eight chambers. Chambers are filled serially from left as in (a), and in parallel via discrete inputs as in (b); fluidic control is achieved by opening and closing red valves surrounding each chamber. This device was used to determine the chemotherapy agent doxorubicin’s IC50 (50% inhibitory concentration) for two types of cancer cells via viability curves drawn from parallel injections of agent concentrations ranging from 10 nM to 100 µM. The injected amount for the multiplexed study was ~100,000 cells, stated as the minimum amount obtained from a fine needle aspirate (biopsy).
Application of this microfluidic analysis approach to very small masses of biopsy, or other, samples is compelling as demonstrated in the case of ovarian cancer. It may be that many disease biopsies from other organs or perhaps forensic or other bio-samples could also benefit from the efficient approach.
Beginning with a Petri dish containing an aqueous cell medium, the procedure entails covering the medium with a second immiscible layer of FC40 fluorocarbon, and then jetting the fluorocarbon through the medium to make contact with and stick to the Petri dish via preferential wetting. The moving jet nozzle can thus define channel & chamber walls bonded to the Petri dish surface and directly write a fluidic channel network according to a CAD layout input. The jet stays in the fluorocarbon, making the fabrication contactless. Writing time depends on the design complexity, but may be about five minutes. A diagram of the fabrication procedure is shown at right above, and a fluidic maze structure created with this technique is show at right below. First author Cristian Soitu’s Twitter feed (@CristianSoitu) has an impressive video showing the creation of some devices.
The authors have done a nice job of characterising the various parameters relevant to creating walls or features from the fluorocarbon, such as jet nozzle height, diameter, flow rate, lateral speed, wall thickness and channel widths. The ability to pipet into enclosed chamber arrays was also explored in terms of volume ranges and resistance to cross-contamination. Preliminary cloning studies with different cells suggested comparable cloning efficiency vs. normal Petri dishes without fluorocarbon structures.
The possibilities afforded by such a direct-write technique are compelling. An ability to create custom microfluidic structures for a given pattern of cells or conceivably other analytes adsorbed on a solid substrate with secluded, sterile and controllable environments seems like a window into new analytical techniques enabled by powerful sampling and work-up strategies. Iota Sciences appears to be moving the technology forward for cell cloning purposes.
A very thorough characterisation paper was published a few weeks ago in Analytical Chemistry by researchers in Amal Alachkar’s group at UC Irvine, and Nicolas Voelcker‘s and Victor Cadarso‘s groups at Monash University. The collaboration made a microfluidic dopamine sensor that detected dopamine in blood or cerebrospinal fluid (CSF) obtained from mice used to model Parkinson’s disease. Dopamine is a small molecule that acts as a neurotransmitter in the brain and as a hormone with different functions elsewhere in the body including blood vessels, kidneys, the pancreas and the immune system.
The microfluidic devices were fairly simple in structure, with a three-electrode configuration used for the amperometric detection patterned on the oxide layer of a silicon substrate, and a single channel/chamber fluidic structure fabricated in PDMS that was bonded to the silicon baseplate.
Characterisation tests showed robust performance. Good repeatability was seen across ten replicate devices, linear ranges extended through 4 decades and included an LoD at 0.1 nM in both CSF and phosphate buffer. The current plots showing the dynamic range appeared quite steady and smooth at 0.1 nM, and well apart from the baseline, so I wonder if a 3-standard deviation mark would lie well below 0.1 nM? Regardless, this was adequate to easily sense the physiological levels of dopamine in the test mice CSF in the range of 0.1-1 nM. It also showed good selectivity in the presence of interferents. The good analytical performance is likely attributable to the small 2.4 µL chamber, relatively large electrode array (~1 mm²) and narrow (50 µm) separation between the electrodes.
The ability to detect dopamine is of great interest, since abnormal dopamine levels are indicative of neurological conditions such as depression, schizophrenia, attention deficit hyperactivity disorder (ADHD) and Parkinson’s disease. In the case of Parkinson’s disease, an effective sensor can help both with diagnosis and with treatment, as patients are often treated with L-DOPA, a chemical precursor to dopamine, to help reach optimal levels.
The authors discuss the possibility of using biopsy samples in devices to perform drug efficacy, safety and toxicology studies before clinical trials, as well as facilitating research in physiology, metabolism and tissue regeneration.


 Time-lapsed photographs of droplet generation of water (vertical channel) in carrier oil (horizontal channel) using their system are shown at right below; the curved black line is the electrode under the vertical channel. The research showed a relationship between applied microwave power and generation time, but with droplet sizes remaining at a constant ~1.8 nL in their 40 µm deep x 210 µm wide channels.
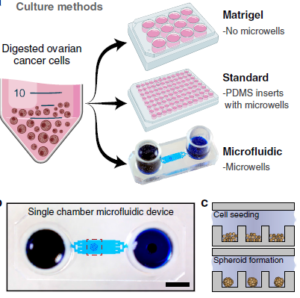
 A first advantage of their microfluidic platform is that it can easily make use of the miniscule amounts of cells afforded by a fine needle biopsy sample. Secondly, the on-chip incubation environment appears to be superior to that of standard microtiter plates when using identical media and culturing methods. After 14 days, 0n-chip viability was typically ~90% vs. ~60% & ~80% for standard microtiter and Matrigel plates, respectively; growth of the spheroid cluster of cancer cells was also significantly better using the chip platform. Figure at right shows micrographs of the spheroid cell clusters in the microfluidic wells (a), and a comparison of viability (b) and spheroid size growth multiple (c) over 2 weeks. Lastly, a multiplexed design shown below
 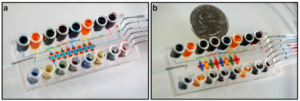 at right was created to allow serial and parallel perfusion across eight chambers. Chambers are filled serially from left as in (a), and in parallel via discrete inputs as in (b); fluidic control is achieved by opening and closing red valves surrounding each chamber. This device was used to determine the chemotherapy agent doxorubicin’s IC50 (50% inhibitory concentration) for two types of cancer cells via viability curves drawn from parallel injections of agent concentrations ranging from 10 nM to 100 µM. The injected amount for the multiplexed study was ~100,000 cells, stated as the minimum amount obtained from a fine needle aspirate (biopsy).
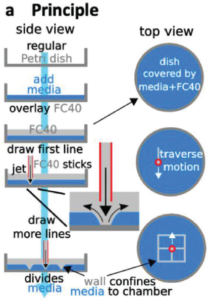
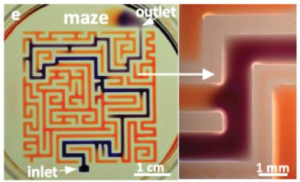 The authors have done a nice job of characterising the various parameters relevant to creating walls or features from the fluorocarbon, such as jet nozzle height, diameter, flow rate, lateral speed, wall thickness and channel widths. The ability to pipet into enclosed chamber arrays was also explored in terms of volume ranges and resistance to cross-contamination. Preliminary cloning studies with different cells suggested comparable cloning efficiency vs. normal Petri dishes without fluorocarbon structures.
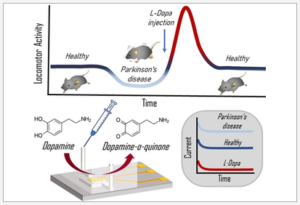
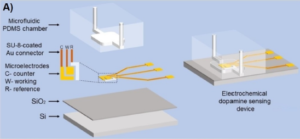 The microfluidic devices were fairly simple in structure, with a three-electrode configuration used for the amperometric detection patterned on the oxide layer of a silicon substrate, and a single channel/chamber fluidic structure fabricated in PDMS that was bonded to the silicon baseplate.
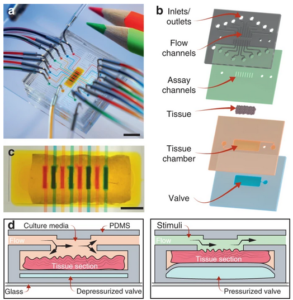
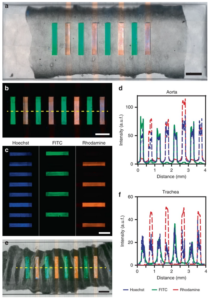 tissue is pressed against the lid to seal the microfluidic channels and allow the simultaneous introduction of discrete drug or tissue culture solutions through each of the eight channels. Characterisation studies shown in the lower image (©Nature – Microsystems & Nanoengineering) demonstrate good permanent sealing and no cross-talk between channels. Also, the continuous periperfusion of media around the sample increased tissue cell viability over the first several hours in the microfluidic device vs. in a petri dish.