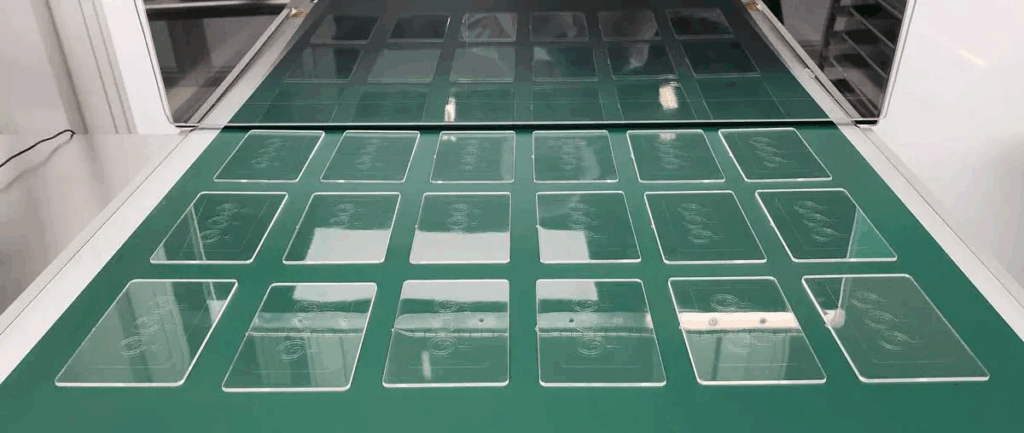
I recently had the privilege of chatting with Anuthasan Balasingam at DBM Medix (Montréal, Canada) about their LiQon™ microfluidics manufacturing process. In short, LiQon™ allows microfluidic devices to be injection moulded directly from a silicon master, which is kind of revolutionary! A photo from DBM Medix of injection moulded polydimethyl siloxane (PDMS) devices manufactured at volume at their facility is shown at right. In the next 2-3 paragraphs I’ll try to provide the context to understand why this is, so if you already understand how microfluidic devices are made out of glass, silicon, as well as hard and soft plastics, you might want to skim or skip ahead. 🙂
How are microfluidic devices made, and from what? Well, it depends; there are quite a variety of ways to make microfluidic devices, but the mainstream approaches that lend themselves well to manufacturing are few indeed. Historically, starting in the 1970s, microfluidic devices were made in glass and silicon using photolithographic processes that were ported over from the semiconductor sector, and that are also used to manufacture MEMS (microelectromechanical systems) devices. Glass and silicon microfluidic device manufacturers include Teledyne MEMS (formerly Micralyne and Dalsa; both in Canada), Micronit (the Netherlands) and Atomica (formerly IMT; USA). In the 1990s, polymer microfluidic prototyping became popular, leading to manufacturing of devices in hard thermoplastics (e.g. polymethyl methacrylate (PMMA), polycarbonate (PC), cyclic olefin polymers and copolymers (COP & COC)) as well as in softer elastomers (e.g. polydimethylsiloxane (PDMS), a silicone rubber). Thermoplastic manufacturers include microfluidic ChipShop (Germany), ThinXXS (Germany), Schott MiniFAB (Australia), while elastomer manufactuers include DBM Medix, HiComp (USA/China), and applications company Standard BioTools (formerly Fluidigm; USA) gets an honourable mention as an applications pioneer in elastomer devices. In some cases, thermoplastics and/or elastomers can be used to make devices through lamination; manufacturers include ALine and MicroMed Solutions (both USA).
PDMS, and every other device material, has particular chemical and physical properties that may make it preferable for a given application, and non-viable for another. In addition, manufacturing capabilities have evolved for all three types of materials (i.e. glass & silicon, thermoplastics, and elastomers), allowing for cost-effective production of launched microfluidic products made from each. In the end, the application’s business and technical requirements dictate the material types and manufacturing processes that are best suited.
Focussing on PDMS for a moment, it is soft and porous (for better or worse, depending on the application), relatively clear in the visible spectrum (~90% transmission from the near IR to the near UV for a 3 mm thick sample, according to a 2019 Heliyon paper from the González-García group), and can be replicated from its cast or mould master with high fidelity, including at micrometer scales, to yield optically smooth devices. Biocompatibility ranges from excellent to unsatisfactory, depending on the application. PDMS has become very popular for device prototyping over the last 20 years largely because a negative mould master can be created relatively easily from silicon, glass, metal or other material, and then the unreacted PDMS can be cast in the mould to create the positive device form, complete with microfluidic channels, chambers, etc. While very convenient for small volume production of 10s or 100s of devices, PDMS casting is not amenable to high volume manufacturing, so the majority of launched microfluidic products have been made from injection-moulded thermoplastics and/or photolithographically patterned glass and silicon, both proven high throughput, cost-effective manufacturing methods. Even if PDMS is a viable or preferred material for a given microfluidic application, it is usually left behind due manufacturing hurdles, such as its slow curing time (Dow’s SYLGARD™ 184 Silicone Elastomer (PDMS) requires 48 h to cure at room temperature, down to 10 min at 150°C), and possible need for chemical release agents to free the material from the mould.
Now, back to DBM Medix! So, what’s the big deal with their LiQon™ process for PDMS prototyping and manufacturing? It directly addresses several of the major manufacturing issues mentioned above.
Devices are made directly from silicon masters, so a) the same process for creating mould masters can be used, and b) the high fidelity fabrication of micro-features possible with a silicon master persists.
The proprietary LiQon™ process is truly injection moulding, not casting, so all the high volume manufacturing benefits of this established process apply. For example: a) shot times are short, on the order of 30 s; b) investments for both prototyping and manufacturing are low; and c) automated production and assembly are in place, so reaching high microfluidic device quality and consistency at an economical pricepoint is attainable.
Mould release agents are not required, so concerns about contamination and biocompatibility of these agents are obviated.
Prototyping turn-around times are pretty fast, around 1-3 weeks.
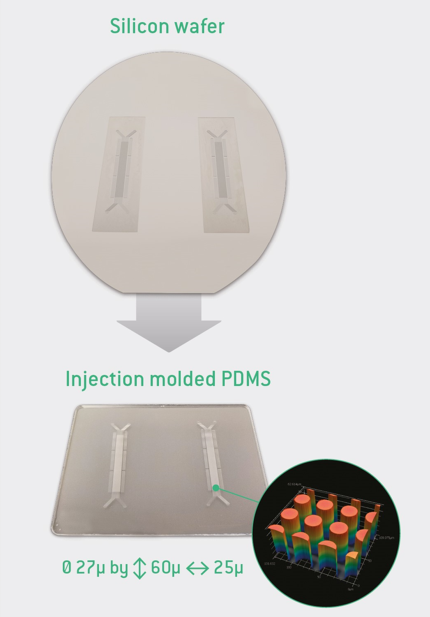
An image from DBM Medix’s LiQon™ info sheet, at right, is helpful, showing the fabrication of some 27 µm pillars (diameter x height x on-centre pitch = 27 x 60 x 50 µm). Above is the silicon wafer with the negative microfabricated pillar array (cylindrical cavities instead of solid pillars), and the injection moulded PDMS device created from it, with the pillars as positive features. A circular close up image is a scanning electron micrograph (SEM) showing the pillars up close, and demonstrating the smooth replication and clean release of these features.
If you think that PDMS could be the right material for your microfluidic/microfabricated device or concept, or if you’re not sure what material would be best, drop me a line. I’m agnostic with regard to the material or method, except that I strive to guide my client towards the materials and fabrication processes that are best suited for their application and business needs. If, after discussing your application in detail, PDMS looks like the winner or a contender, we can contact DBM Medix together to explore what doing your prototyping and manufacturing with them might look like.
As a Board Member of the Microfluidics Association (MFA), I’ve gained several new insights about different areas of the microfluidics industry over the last few years, insights that are not apparent from my usual perspective as a product development consultant. One new area for me, and a major focus for the MFA, is that of product standards and standardisation; the MFA has had leading and supporting roles in the creation of three ISO microfluidics standards (ISO 22916:2022, ISO 10991:2023 and ISO/TS 6417:2025) over the last few years, with more in the funnel, some available as downloadable white papers on the MFA site.
A major thrust in this effort is the work from the earlier MFMET I project, and now as of June 2025, the newly funded MFMET II project, on whose advisory board I sit. The Portuguese members of this consortium (Instituto Português da Qualidade, NOVA School of Science and Technology, INESC MN and Instituto Superior Tecnico, Universidade de Lisboa), led by Elsa Batista (MFMET Project Coordinator and also Board Member for MFA) published an excellent paper in Frontiers in Nanotechnology last month entitled “Advancing calibration techniques for accurate micro and nanoflow measurements“. Their research compared 4 different flow rate calibration methods for microflow pumping (syringe pumps straight to calibration, and also pumping through a microfluidic chip first) and sensing, in terms of each method’s analytical performance as quantified by accuracy and precision (more on these terms later). This is really good, rigorous work which is important for the field of analytical chemistry, for other branches of chemistry, and for other sciences and fields of engineering.
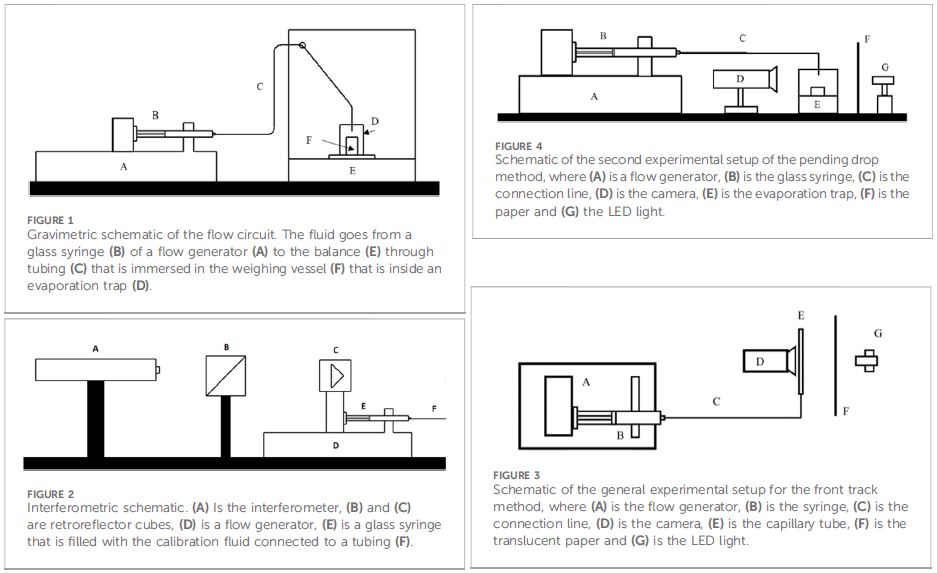
The four calibration methods used were gravimetric (measuring the mass of a pumped volume of liquid), interferometric (measuring the linear displacement of the syringe plunger optically via laser interferometry), ‘front track’ (measuring the linear displacement of the leading meniscus of the water/air interface inside a capillary via high-resolution optical imaging) and ‘pending drop’ (measuring the size of a suspended, growing droplet via high-resolution optical imaging). These methods are shown schematically in Figures 1-4 from the paper, reproduced below as Figure 1.
As any trained scientist or engineer can imagine, arriving at a valid estimation of the different sources of error involved with any of these flow rate measurements is quite involved. For all methods, the volume pumped from the syringe was quantified gravimetrically by measuring the mass of water displaced over a given syringe plunger stroke distance. All measurement instrumentation had to be validated, so calibration certificates were obtained for analytical balances, chronometers and thermometers used. In some cases, established literature values for physical constants were used. Tables showing the different error components were included for each measurement approach, including factors such as temperature, expansion coefficients, evaporation, and buoyancy, in addition to direct measurements of mass, time and distance.
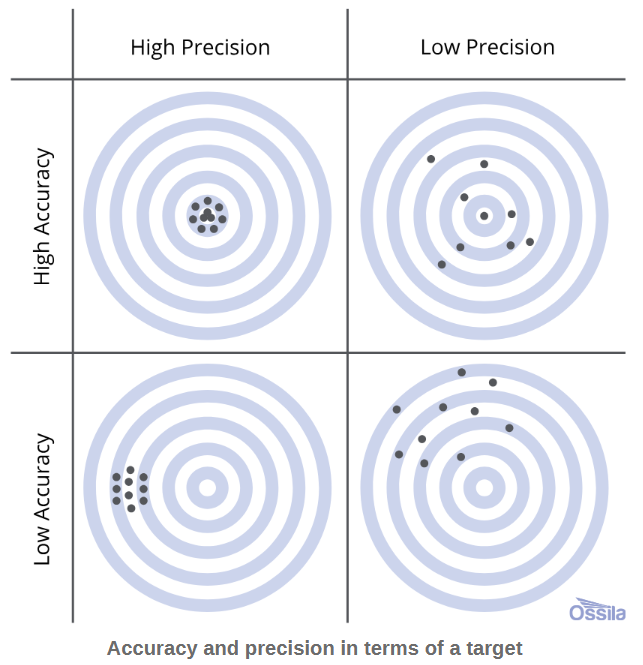
Figure 2: Illustration of aiming error in terms of accuracy and precision using a target practice analogy. (Image and copyright belong to Ossila Ltd.)
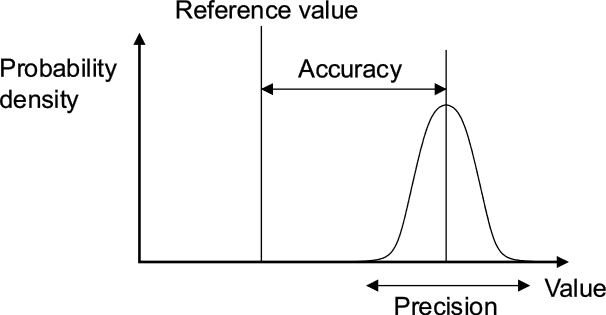
Since the methods are contrasted based on their accuracy and precision as quantitative measurements of error, it’s probably useful to define accuracy and precision as they are used scientifically: accuracy describes how close measurements are to a ‘target’ or reference value, while precision describes how close repeat measurements are to each other (regardless of accuracy). This is depicted well with a target practice analogy, as shown at right in Figure 2. In a scientific context such as the paper being highlighted, many replicate measurements are made of the variable in question (e.g. mass, volume, flow rate), to reduce the error measured by accuracy and precision. For most types of measurements (including those in this paper), if the measurements are binned and the number of measurements at any value are plotted against the value of the variable itself, a Gaussian distribution (or ‘bell’ curve) is produced. This is illustrated in Figure 3, below right. Here, the proximity of the centre of the bell curve to the ‘real’ value shows the accuracy of the measurements and method, while the spread of the measurements shown by the width of the bell curve shows their precision.
Figure 3: Illustration of measurement error as accuracy and precision. (Image is from Wikipedia and copyright belongs to Perkaje and Cutler)
In addition (and unfortunately), sometimes different fields of science and/or geographic regions use different terms or units to describe the same thing (I think pressure is the poster child, here: atm, psi, kPa, hPa, bar, mbar, Torr, mm Hg … !!). In this paper, accuracy is analogously referred to as simply ‘error’, while precision is referred to as ‘uncertainty’. (Sidebar: these terms are poorly conceived, in my view, but my short foray into terminology standards leads me to believe that they arrive by royal decree from IUPAC (International Union of Pure and Applied Chemistry). All may not hail IUPAC, with (yet more) misses like this. Anyways, end of rant, back to the story!)
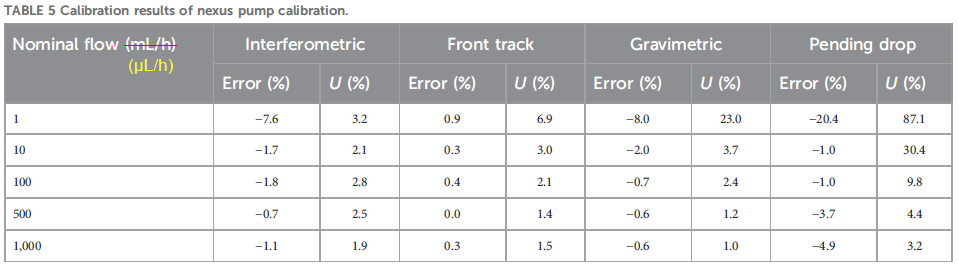
All four calibration methods were applied to a Nexus syringe pump operating at five flow rates ranging from 1-1000 µL/h, and the results shown in their Table 5, reproduced below as Figure 4. There’s a corresponding graph for this data, but unfortunately the data for each method were superimposed on each other at each flow rate, so the graph is hard to read. “Error (%)” is the relative accuracy, i.e. ((set point) – (measurement average)) / (measurement average) • 100%, while “U (%)”, uncertainty, is the relative standard deviation, RSD, or coefficient of variation, CV, of the measured values, i.e. RSD = CV = σ / (measurement average) • 100%, where σ is the standard deviation of the measured values.
This table offers the best contrast of the methods, with the precision as RSDs (“U (%)”) telling the tale. The interferometric method is the clear winner, maintaining very respectable low single digit RSDs right down to the minimum 1 µL/h tested, while front track, gravimetric and pending drop could only do this at 10, 10 and 100 µL/h, respectively. Understandably, accuracy (“Error (%)”) goes down the drain once the RSDs skyrocket, indicating the method is no longer within its dynamic range.
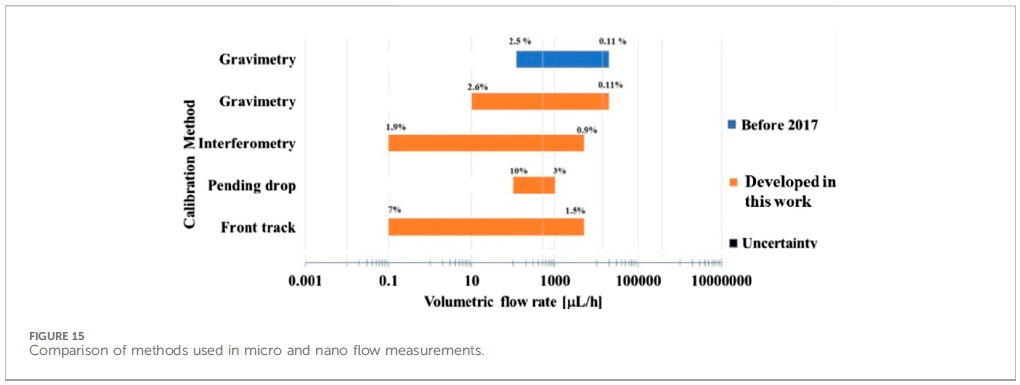
After looking at method performance for some other pumps, flow sensors, and with a chip coupled or decoupled, the team generated a bar chart in their Figure 15 to show the dynamic ranges for each method, including their previous gravimetric work. This figure is reproduced below as Figure 5.
The authors discuss the pros and cons of each method vis-à-vis their performance, highlighting that:
the superior performance of the laser interferometric method is offset somewhat by the higher cost of instrumentation;
the front track method is relatively inexpensive, and its precision (already good, IMO) could be improved with a smaller bore imaging capillary;
the gravimetric method is inexpensive, simple to implement, and offers good performance; and
the pending drop method could be improved significantly with better evaporation control.
Based on design and precision results, I would argue that the gravimetric method, while a step better than the pending drop method, is also more susceptible to evaporation, so improving evaporation control would likely improve both methods. There is also likely a way to make a diode laser-based interferometer that would be economical at volume, though I’m not sure that there are attractive applications that would warrant the product development.
This paper is solid and provides calibration information directly applicable to the pumps and flow sensors tested, but also and perhaps more importantly, information regarding the useful flow rate ranges for each calibration method. It’s a ‘nuts and bolts’ paper (like some I’ve written) that has no hope of reaching a flashy, high-impact journal, but which is of tremendous value, in my opinion, to microfluidic researchers and product developers in a variety of private sector, government and academic lab settings who can use this information as foundation material for their work.
So, what in blazes is a “coacervate”, and how does any of this relate to understanding and curing diseases, you ask? Great questions, the search for the answers to which led me to an excellent 2019 review in Annual Reviews entitled “Liquid–Liquid Phase Separation in Disease” by Alberti and Dormann at the Technical University of Dresden and Ludwig-Maximilians University in Munich, respectively. Since this part is really interesting and provides context for the relevance of the Israeli research, we’ll start here. Fair warning: this is rather complicated, but I’ll try to simplify it as much as possible, without misrepresenting anything (apologies to those in the field who detect an unwitting gaffe :-).
Liquid-liquid phase separation (LLPS) is a process by which one or several solutes in a solution self-concentrate into their own phase, essentially forming microdroplets termed condensates or coacervates. It turns out that LLPS is now believed to be fairly widespread for a number of different peptides and proteins within cells, and to underlie several biological processes; in some cases, these coacervates are essentially membraneless organelles in the cell. The review illustrates the general mechanisms by which abnormal LLPS may cause disease, such as a) genetic changes in a protein that change its solubility and thus tendency to form a coacervate, b) genetic changes in a regulator that changes when or where the coacervates forms (i.e. in the cytoplasm vs. nucleoplasm), and c) changes in physiological conditions (e.g. pH, salinity, osmotic pressure, etc.) that may promote or inhibit coacervate formation. The authors then provide generalised and specific examples of these mechanisms in action for several neurodegenerative diseases (such as Alzheimer’s, Parkinson’s and Huntington’s disease, frontotemporal dementia (FTD), amyotrophic lateral sclerosis (ALS or Lou Gehrig’s disease)), cancers (apparently many or all cancers via certain common processes such as high cellular replication) and infectious diseases (such as a large number of viruses via the formation of their coacervate viral factories, as well as many bacterial and fungal infections via common processes such as solidified cytoplasm in drug-resistant strains). Their Figure 3, reproduced above right as Figure i, is a helpful illustration of these processes happening in a cell.
Specific examples of these mechanisms are beyond the scope of this post (… and beyond my understanding of the biochemistry, if I’m being honest :-), but I find even the generalised examples fascinating, and maybe you will too. Paraphrasing directly from their caption for the figure above, here are some. In neurodegenerative diseases, mutations, abnormal posttranslational modifications (PTMs, normally used to complete the synthesis of a protein), altered subcellular localization (i.e. getting the proteins to the wrong part of the cell), or impaired protein quality control (PQC; an enzyme system that might e.g. keep a transported protein from phase-separating and losing function) can promote the formation of ectopic condensates (phase separation in the wrong cellular location) as well as precipitating to a solid, both leading to protein aggregates in diseased tissue. These aggregates can impair ribonucleoprotein (RNP) granules and cellular factors (proteins), contributing to neuronal dysfunction and cell death. In cancer, mutations in signaling receptors (e.g. nicotinic acetylcholine receptor, used to contract muscles in response to acetylcholine, or release dopamine in response to nicotine) can alter the formation of signalling clusters at sites of DNA transcription (into RNA) or DNA damage repair. This, in turn, can alter cellular signaling cascades, impair transcription or DNA damage repair, and thus promote a proliferative and malignant state of a cell (tumour growth). In viral infections, liquid-like viral factories form through phase separation of certain viral proteins, promoting viral genome replication or altering the antiviral immune response. Some antiviral sensors in our immune system detect “pathogen-associated molecular patterns” (PAMPs) and form a separate phase through LLPS upon binding to foreign DNA or RNA, thus stimulating an immune response.
So, why do any of these LLPS-based mechanisms matter? Well, the better they are understood, the better drugs and other therapeutic strategies can be designed to intercede and either hinder a diseases-based LLPS process, or promote/defend a natural one, to inhibit disease progress in the end. If we consider neurodegenerative diseases for example, it has been known for some time that they all show accumulations of cytoplasmic or nuclear proteins in certain regions of the brain, and that these protein aggregations are thought to drive the degeneration. The mechanisms by which this happens are fascinating, and are based on liquid-liquid phase separation.
In the case of ALS and frontotemporal dimentia (FTD), a key protein is “Fused in Sarcoma”, or FUS. FUS is involved in DNA transcription, repair and splicing as well as mRNA transport in cells such as neurons; in a 2013 paper entitled “Fused in sarcoma (FUS): An oncogene goes awry in neurodegeneration” published in Molecular and Cellular Neuroscience by Dormann, FUS’s role in neurodegeneration is described in detail, and its normal functions in the cell are illustrated in Figure 3 from the paper, reproduced at right as Figure ii. One failure mode is not fully performing the PTM of methylation of the arginine amino acids in the FUS protein. In FTD patients, the arginines are either unmethylated or monomethylated, which causes phase separation of the FUS, impairing its ability to act. A second failure mode involves mislocalisation of the FUS protein.
In the case of ALS, a mutation in FUS’s “nuclear localisation sequence” (NLS, the amino acid sequence ‘code’ along a protein like FUS that allows it to be imported into the cellular nucleus) impedes its ability to bind to nuclear import receptor Transportin (like an ‘admission pass’, activated by the NLS code, that allows the bearer (FUS) to enter the nucleus). Transportin not only clears its cargo protein (FUS or others) for entry into the nucleus, it also suppresses LLPS and aggregation, so impeded FUS-transportin binding leads to accumulation, phase separation and precipitation of the FUS in the cytoplasm (termed mislocalisation). In the case of FTD patients, the issue is aggregation of the Transportin itself, rendering it inactive, i.e. unable to bind to the FUS and chaperone it to the nucleus, leading again to FUS mislocalisation. Critically, these LLPS mechanisms suggest research and development opportunities in e.g. drug therapies that may block or counteract a particular disease mechanism such as genetic mutation, mislocalisation, etc.
These disease examples are the tip of the iceberg in this field of research; many more specific examples are laid out in Alberti and Dormann’s review. If the (hopefully accurate) summaries above piqued your interest, reading the full review will certainly provide a more fulsome understanding.
So, the relevance of LLPS chemistry to the modus operandi of neurodegenerative, cancer and viral diseases seems sound, but what benefit can microfluidic devices and processes confer? The answer to this is provided in the research article from Reches’ group. In a nutshell, they did a fairly thorough job of characterising synthetic coacervates made from short polypeptides, and looking at their ability to encapsulate and protect molecules within (e.g. for drug delivery).
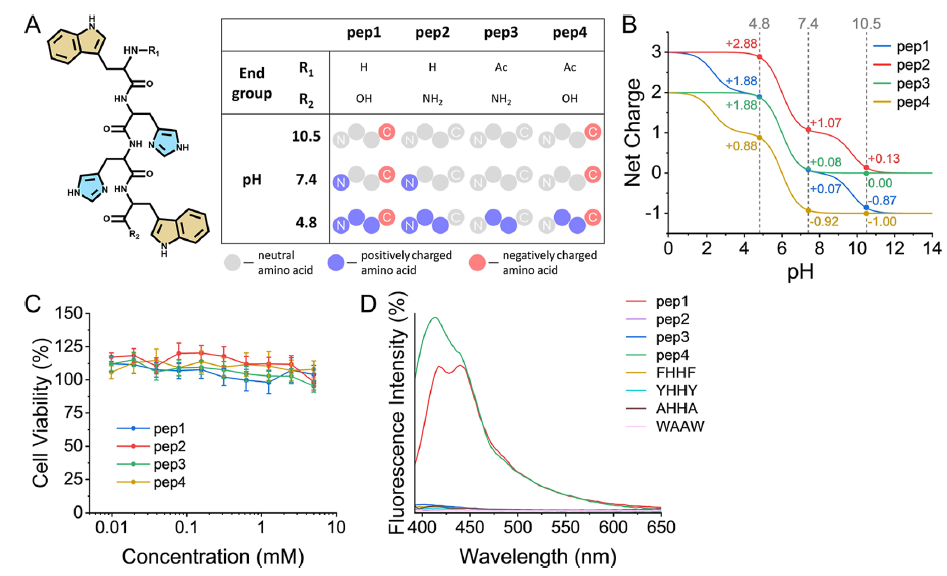
The researchers designed their four synthetic coacervates as being made from four short tetrapeptides, made from the amino acids tryptophan-(histidine)2-tryptophan, with different hydroxy, amino and acetyl terminations differentiating them. Their structure, charge states and biocompatibility were clearly shown in Figure 1 of their paper, reproduced at right as Figure iii. As a result of these different terminal groups, the four tetrapeptides, depicted in A, have significantly different pKa values at their acidic/basic groups, lending them different charges at a given pH, as shown in B. All four peptides performed well in ovarian cell viability tests (as a measure of biocompatibility), as shown in C.
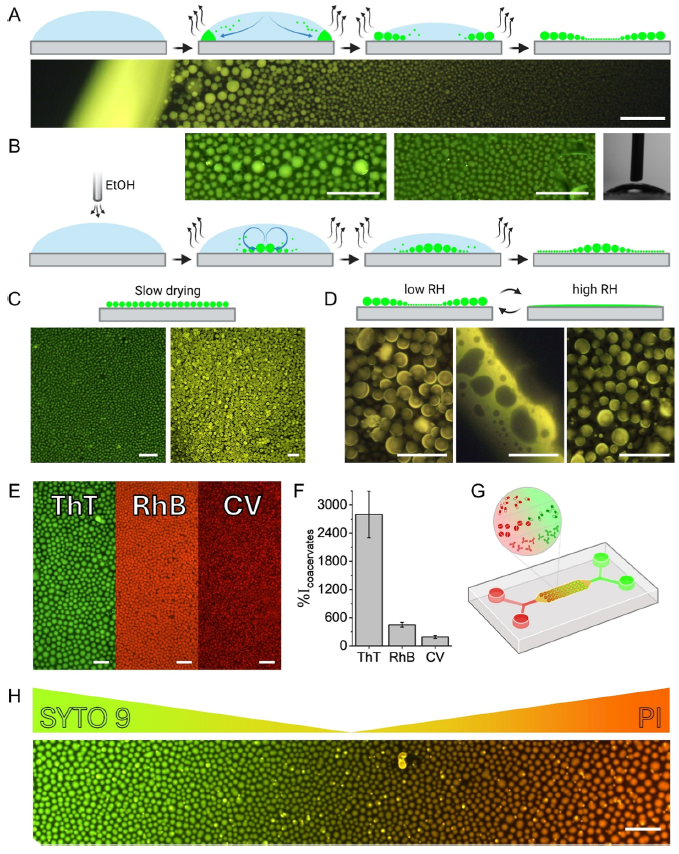
Characterisation of the formation and deployment of the peptide coacervate separated phase is well illustrated in Figure 6 of their paper, reproduced at right as Figure iv. In A, we see the normal evaporative formation of coacervate spheres (green) in a pH buffer solution; the smaller coacervate spheres are drawn to the solution drop perimeter by capillary action where they coalesce into larger droplets. The photo shows a fluorescence photomicrograph at the edge of the drop, with larger coacervate spheres towards the perimeter. The same process occurs in B, but ethanol vapour is blown over top of the solution drop to reduce the surface tension and in turn counter the capillary flow via the Marangoni effect (e.g. tears of wine), reversing the size distribution in the coacervate spheres vs. A. In C, slow drying is seen to produce a single coacervate size (or tight distribution, while in D, high relative humidity is shown to disassemble or merge the coacervate spheres (reversible with low RH). Frame E shows encapsulation of three dyes, thioflavin T, rhodamine B and crystal violet, in the coacervate spheres, while frame F shows the increase in fluorescence intensity for dye buffer solutions with the coacervate peptide vs. without (from ~2x to ~28x), showing the effective partitioning of the dyes in the coacervate phase. Frame G shows a schematic of the microfluidic device used to create dye gradients with green Syto 9 and red propidium iodide dyes, while frame H shows a photomicrograph of dye concentration gradient in the encapsulated dyes created by manipulation in the device. A somewhat closer look by the group at quantitative dye encapsulation showed a pH dependence, which is not surprising given the multiple acid groups and pKa values involved for each of the four tetrapeptide coacervates (referred to in Figure iii).
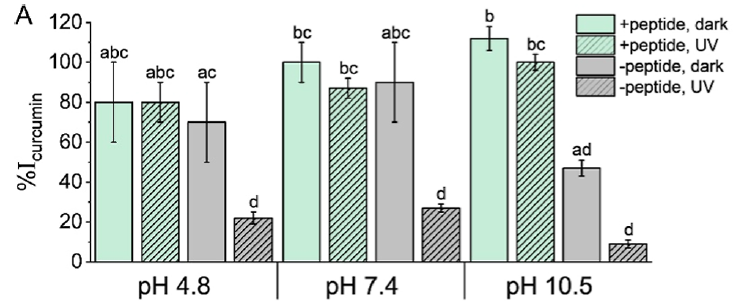
A last important area of performance they characterised was the protective antioxidant properties of the peptide coacervates on their encapsulated charge. They chose the popular dietary supplement curcumin — the natural polyphenol in turmeric giving it its yellow colour — as the encapsulated subject to test one of the coacervate’s protective abilities. Both alkaline pH and UV irradiation cause curcumin degradation and decomposition, so optical absorbance of intact curcumin was used to measure antioxidant protection afforded by the coacervate phase in comparison to a solution with no coacervate. The results are shown in their Figure 7A, shown at right as Figure v. At an acidic pH of 4.8 or neutral pH of 7.4, the unprotected curcumin (grey) was not significantly worse than the coacervate-protected curcumin (green), though the UV radiation did significantly degrade the unprotected curcumin (grey, hatched), but not the protected curcumin (green, hatched). At the alkaline pH of 10.5, both the alkalinity and UV radiation significantly degraded the unprotected curcumin (grey & grey hatched), but the coacervate was an effective protective sheath for the curcumin (green & green hatched).
If you’ve followed this far, then congratulations are in order 😉 , and let’s now consider what all this research might eventually translate into! First, let’s list some of the salient potential benefits of the synthetic tetrapeptide coacervates in the second paper:
they’re made from amino acids, and are biocompatible in ovarian cells;
they effectively encapsulate and concentrate the dyes tested;
they confer alkaline and UV antioxidant protection;
their sphere formation morphology can be tailored by several factors including humidity, ionic strength, presence of solvents (and perhaps surfactants?); and
while these first peptide coacervates are a starting point, the nature of the coacervate phase could easily be tailored through choice of peptides (or other molecules or polymers), chain length, derivatisation, etc. to optimise host/drug compatibility, affinity or selectivity, encapsulation protection, etc.
How could this knowledge be built on? The authors speculated that the coacervate characterisation and performance shown in this study could lead to bio-applications such as the development biosensors as well as the encapsulated delivery of drugs and dietary supplements. I would add that there could potentially be organ-on-chip (OOC) applications, where the interactions of synthetic coacervates with the cells of a given target disease tissue, and perhaps with the natural coacervates within, could be tested. In some cases, such OOC studies would be precursors to the development of therapeutic drug delivery systems.
The authors made an initial foray into microfluidic manipulations to generate dye gradients. It is tempting to look further at the use of microfluidics to validate the effectiveness of coacervate constituents (peptides or others) to encapsulate a drug (or other ‘cargo’ molecule) under appropriate conditions, or the effectiveness of a coacervate-drug package to be delivered to the target organ tissue cells under the physiological conditions appropriate for that organ. Just as the dye gradient was shown here, other biologically relevant gradients could be explored. For coacervate encapsulation, perhaps pH, ionic strength, coacervate and drug concentrations, etc. would be of interest; for drug delivery, perhaps drug dosage, variations in physiological conditions owing to the condition itself, or owing to an additional condition — physiological changes at the cellular level in an Alzheimer’s patient that also has high cholesterol or diabetes, for example (I’m just musing about what particulars would be relevant). The ability to easily create gradients, isolate test areas, plumb reagents in and out, multiplex the conditions explored and tightly control processes on a small scale in microfluidics can help accelerate the development of a disease therapy built on the foundation of this knowledge.