
This is just a quick post about an excellent tutorial on electrochemical impedance spectroscopy, or EIS; EIS is also the foundation of electrical cell-substrate impedance sensing, or ECIS, used in organ-on-a-chip devices, discussed later. The tutorial is from Mamas Prodromidis’ group in the Department of Chemistry at the University of Ioannina (Greece) and was published in ACS Measurement Science Au in 2023. I have a decent understanding of other areas of electrochemistry, but not of EIS, so I found it very helpful in explaining how EIS works in terms of real chemical systems represented by equivalent electronic components, and how it can be used to characterise such a system. It also offers user-interactive material to help test your understanding of the material, if you’re keen (i.e. a solid understanding of EIS is mandatory in your current project! ;-). It goes over the difference between the resistance of resistors, the reactance of capacitors and inductors, and how these sum together as impedance by real and imaginary numbers for resistance and reactance, respectively. Since this is an alternating-current (AC) method, the math of circular/sinusoidal functions including voltage-current phase shifts (for capacitors and inductors) and changes in amplitude is also reviewed.
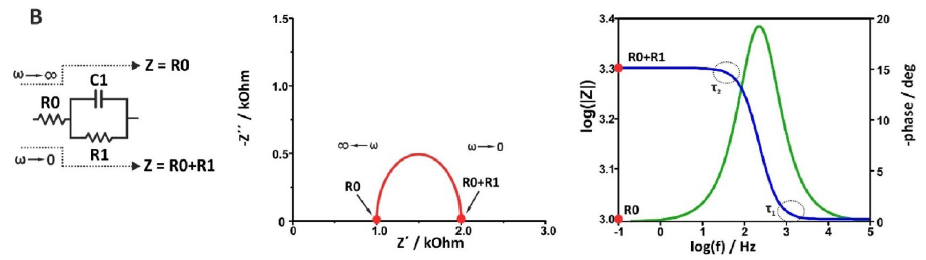
So how does it work? A key output of EIS is a graph called a Nyquist plot, which is a plot of the two impedance components, reactance (imaginary component Z”) versus resistance (real component Z’). It can be used to characterise a wide variety of electrochemical systems (e.g. corrosion studies, semiconductors, fuel cells, batteries), including analytical electrochemical detection in macro- or microfluidic systems. An equivalent circuit approximation that mimics a three-electrode electrochemical system to some extent together with its corresponding Nyquist plot (Z” vs. Z’), Bode plot (Z vs. AC frequency) and phase angle plot (current—voltage phase shift vs. AC frequency) is provided in their Fig. 9b, reproduced below. In the equivalent circuit on the left, R0 represents Ru, the ‘uncompensated’ ohmic resistance of the electrolyte between the working and reference electrodes (WE & RE); R1 represents Rp, the polarisation resistance of the electrodes with frequency of 0 (i.e. just direct current (DC)); and C1 represents Cdl, the capacitance associated with charging and discharging the electrical double layer at the electrode/electrolyte surface. The current paths in the equivalent circuit at left are shown as dotted lines at low and high AC frequency, where the capacitor reactance dwarfs or is dwarfed by the resistor’s resistance, respectively. This is reflected in the Nyquist plot (middle) as a minimum impedance from the resistance of R0 at high AC frequency scaling up to a maximum impedance of resistances R0 + R1 via increasing reactance contributions from capacitor C1 as the AC frequency drops. Viewed another way, the Bode plot (right) shows the total impedance (blue trace) at R0 + R1 until the AC frequency is sufficient to drop the reactance of C1, allowing it to compete with R1 until there is no impedance through C1 and the total impedance is simply R0. While this transition happens, the voltage-current phase shift (green trace, also at right) caused by the capacitor competing becomes active (from ~10-10,000 Hz), and then fades away at higher frequencies.
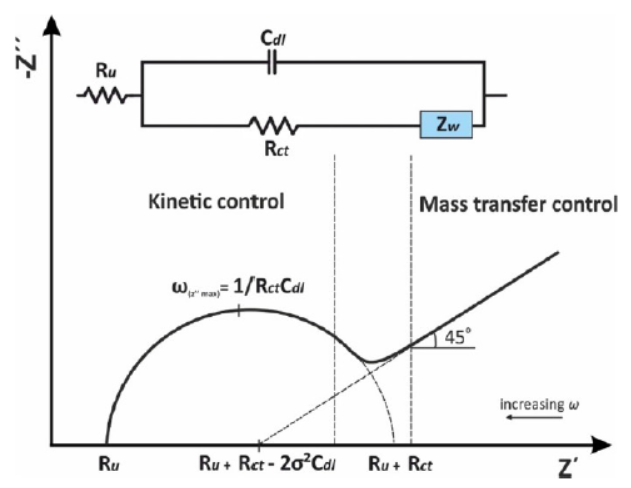
It gets *a lot* more complicated than this as one moves to a real electrochemical cell, as the mass transport to the electrode predominate at lower frequencies, while the desired Faradaic reaction predominates at higher frequencies, leading to a Nyquist plot displayed in their Figure 14, shown at right. I won’t try to explain this in detail, but they do, so by all means dive into their tutorial. 🙂
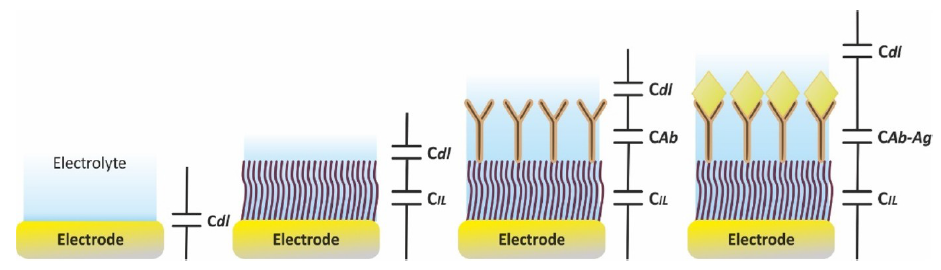
The last technical aspect I want to highlight is how this can be used in a typical biosensor analytical device. The key in this case is the changing set of serial resistances added to Cdl as a result of the additional layers on the electrode, which are the basis for the real experimental measurements. This is nicely illustrated in their Figure 31, shown below.
For context, EIS is the foundation for an increasingly popular detection method for organ-on-a-chip (OoaC) devices, also referred to as microphysiological systems (MPSs). An OoaC recreates a miniaturised ‘organ’ in a microfluidic/lab-on-a-chip device, using the microfluidics to create and control the cellular environment — bioanalytical systems on stereoids. ECIS is a very powerful tool in the context of cellular biology and allows a fairly deep understanding of the cell layer(s) representing a model organ and/or disease system being used to study e.g. drug efficacy, toxicity, cosmetic toxicity, etc. Popular trans-epithelial electrical resistance (TEER) values can also be derived from ECIS measurements. OoaC research is a booming area with compelling advantages of creating a physiologically accurate cellular environment, ability to use human cells, reducing or eliminating the need for animal testing, and being highly controllable and customisable by virtue of the microfluidic networks used to create, maintain and adjust the cell structures and their environment. Being able to continuously monitor the health status and reactions of organ models in OoaC systems with ECIS is increasingly in demand, as I witnessed recently at the MPS 2026 World Summit in Washington D.C. in May of this year.
If you need to deepen your understanding of EIS as a foundation bio-sensing or organ-on-a-chip, I highly recommend this tutorial. They take pains to explain things carefully and precisely, so you may be able to spend some time and be able to wrap your head around this topic at whatever depth is necessary, as I have. 🙂